Fig. C.1
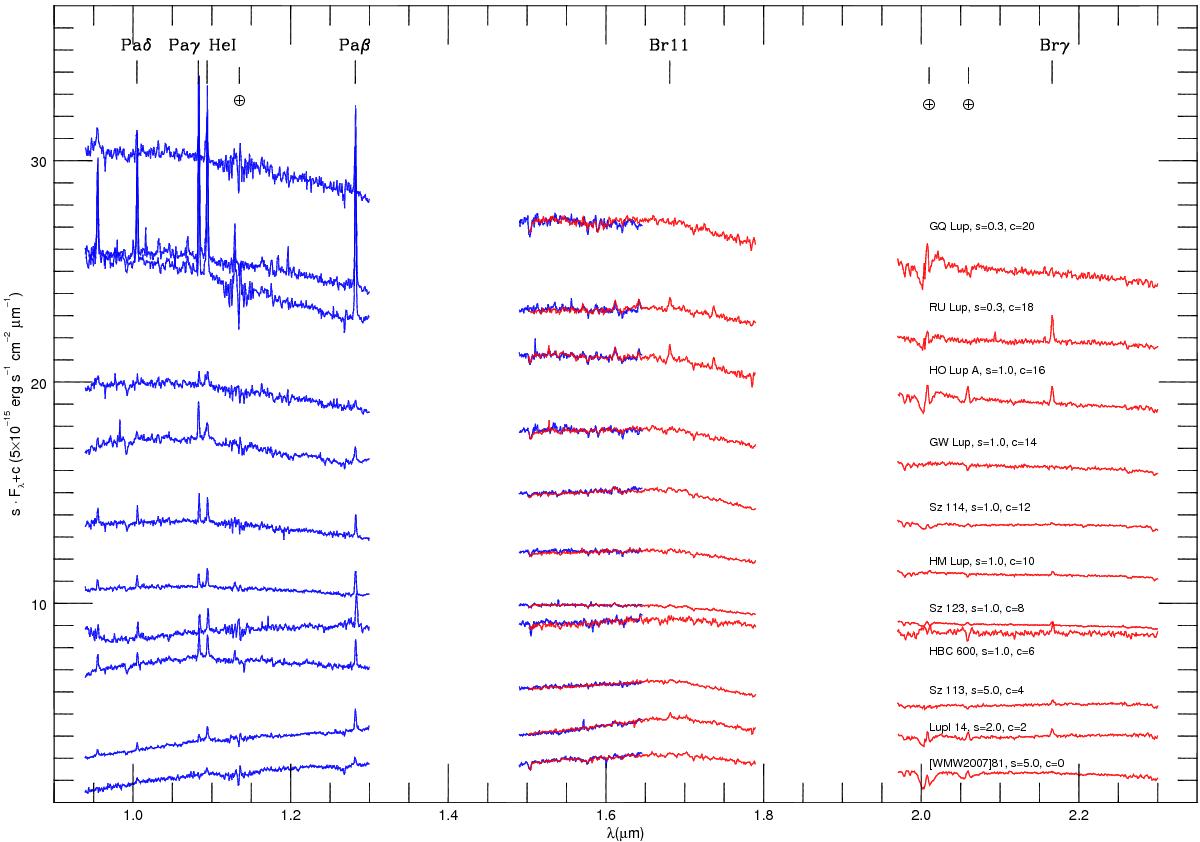
SofI near-IR spectra for a few selected Lupus and Serpens sources. Different colours refer to the two SofI grisms (blue and red). Spectra are shown in flux units of 5 × 10-15 erg s-1 cm-2μm-1 and were offset by a constant c and multiplied by a scale factor s (both indicated) for better visualisation. Wavelength intervals heavily corrupted by atmospheric absorption were removed. The position of the main emission lines present in the covered spectral range is indicated, as well as residuals from atmospheric features.
Current usage metrics show cumulative count of Article Views (full-text article views including HTML views, PDF and ePub downloads, according to the available data) and Abstracts Views on Vision4Press platform.
Data correspond to usage on the plateform after 2015. The current usage metrics is available 48-96 hours after online publication and is updated daily on week days.
Initial download of the metrics may take a while.