Fig. B.1
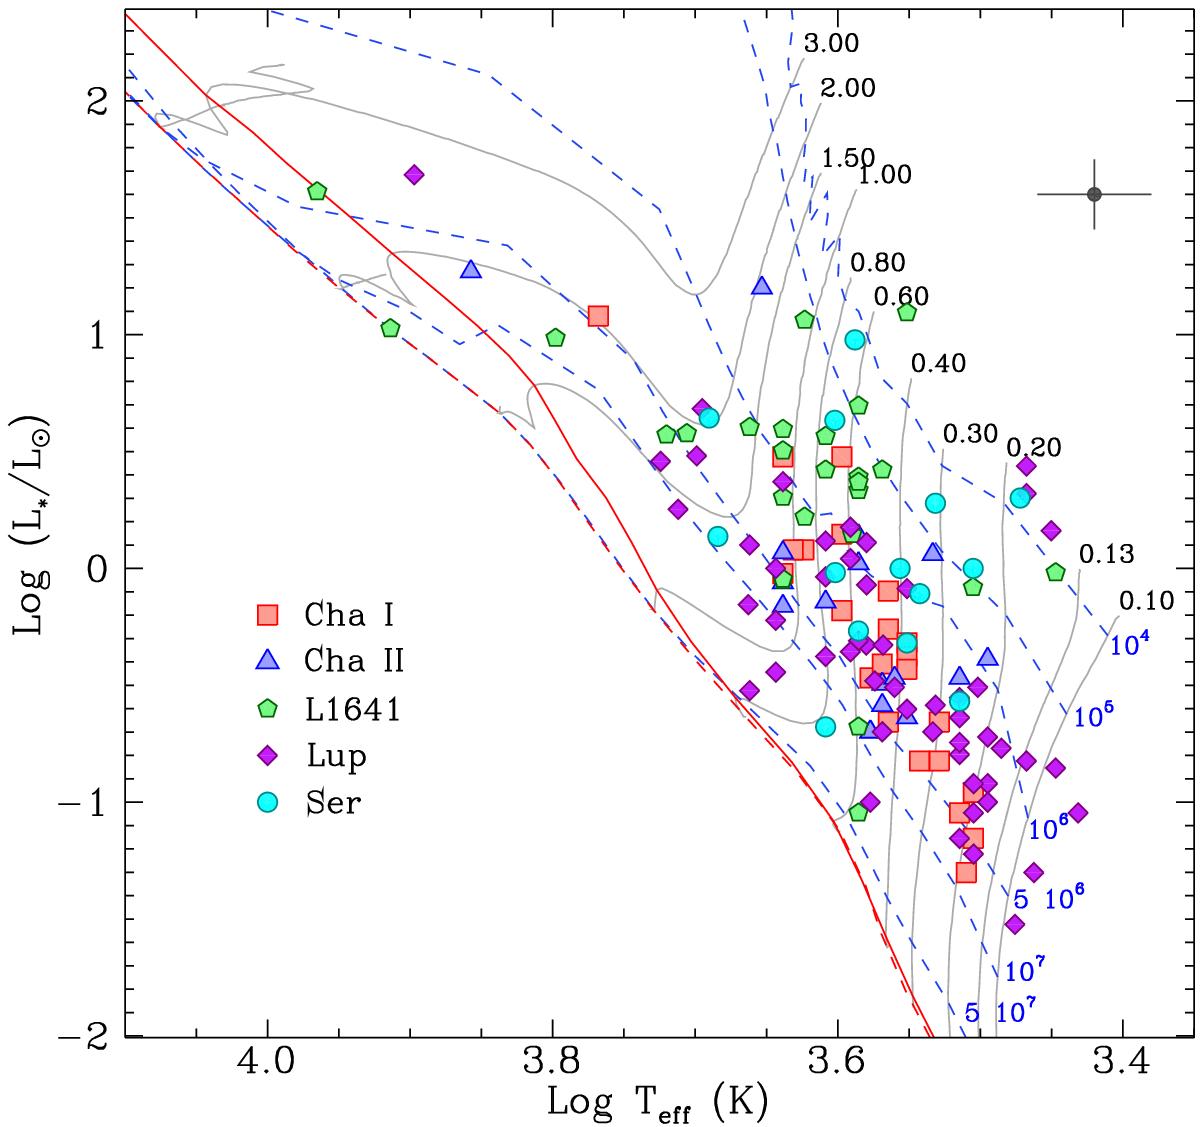
HR diagram for the sources of the five star-forming clouds analysed in POISSON (see legend). Superposed evolutionary tracks for labelled stellar masses in M⊙ (grey lines), isochrones for labelled time in years (blue dashed lines), ZAMS (solid red line), and early main sequence (dashed red lines) are taken from the models of Siess et al. (2000). The point with error bars shows the mean uncertainty on the position of the single sources.
Current usage metrics show cumulative count of Article Views (full-text article views including HTML views, PDF and ePub downloads, according to the available data) and Abstracts Views on Vision4Press platform.
Data correspond to usage on the plateform after 2015. The current usage metrics is available 48-96 hours after online publication and is updated daily on week days.
Initial download of the metrics may take a while.