| Issue |
A&A
Volume 562, February 2014
|
|
|---|---|---|
| Article Number | A45 | |
| Number of page(s) | 22 | |
| Section | Interstellar and circumstellar matter | |
| DOI | https://doi.org/10.1051/0004-6361/201321954 | |
| Published online | 04 February 2014 | |
Online material
Appendix A: Details of PACS observations
Table A.1 shows the observing log of PACS observations used in this paper. The observations identifications (OBSID), observation day (OD), date of observation, total integration time, primary wavelength ranges, and pointed coordinates (RA, Dec) are listed. All spectra were obtained in pointed/chop-nod observing mode. Additional remarks are given for several sources. G327-0.6 and W33A observations were mispointed. NGC 6334-I, W3IRS5, and NGC 7538-IRS1 spectra were partly saturated and re-observed (re-obs). Two observations each of W51N-e1, G34.26, G5.89, and AFGL2591 were done using different pointing.
Log of PACS observations.
Appendix B: Continuum measurements
Table B.1 shows the continuum fluxes for all our sources measured using the full PACS array. The fluxes were used in the spectral energy distributions presented by van der Tak et al. (2013).
Full-array continuum measurements in 103 Jy.
Appendix C: Tables with fluxes and additional figures
Table C.1 shows line fluxes and 3σ upper limits of CO lines toward all our objects in units of 10-20 W cm-2. For details, see the table caption.
Figure C.1 shows blow-ups of selected spectral regions of W3 IRS5 with high-J CO, H2O, and OH lines. Figures C.2 and C.3 show blow-ups of selected CO and OH transitions towards all sources.
CO line fluxes in 10-20 W cm-2.
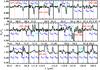 |
Fig. C.1
Close-ups of several of the H2O, CO and OH lines in W3IRS5 as shown in Fig. 1. The rest wavelength of each line is indicated by dashed lines: blue for H2O, red for CO, and light blue for OH. Identifications of the undetected lines in the presented spectral regions are shown in parenthesis. |
| Open with DEXTER | |
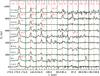 |
Fig. C.2
Close-ups of several transitions of CO lines in the PACS wavelength range toward all sources. The spectra are continuum-subtracted and shifted vertically for better visualization. |
| Open with DEXTER | |
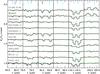 |
Fig. C.3
Normalized spectra of OH doublets for all our sources at central position. Doublets at 71 and 98 μm are excluded because of poor calibration of those spectral regions observed with PACS. OH doublet at 84.4 μm is a blend with the CO 31–30 line, whereas OH at 65.13 μm can be affected by H2O 625–514 at 65.17 μm. |
| Open with DEXTER | |
Appendix D: OH in low and intermediate mass sources
Figures D.1 and D.2 show rotational diagrams of OH for low- and intermediate-mass young stellar objects based on the fluxes presented in Wampfler et al. (2013). Only the sources with at least three detected doublets in emission (out of 4 targeted in total) are shown in diagrams. Rotational temperatures and total numbers of emitting molecules are summarized in Table D.1. For low-mass YSOs, a single component fit is usually not a good approximation (with the exception of L1527 and IRAS15398). In the intermediate-mass YSOs, on the other hand, such an approximation holds and results in very similar rotational temperatures of OH Trot ~ 35 K for all sources except NGC 7129 FIRS2.
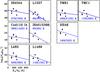 |
Fig. D.1
OH rotational diagrams (from emission lines) for low-mass young stellar objects (fluxes from Wampfler et al. 2013). |
| Open with DEXTER | |
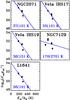 |
Fig. D.2
OH rotational diagrams (from emission lines) for intermediate-mass young stellar objects (fluxes from Wampfler et al. 2013). |
| Open with DEXTER | |
OH rotational excitation and number of emitting molecules  based on emission lines for low- and intermediate-mass sources.
© ESO, 2014
Current usage metrics show cumulative count of Article Views (full-text article views including HTML views, PDF and ePub downloads, according to the available data) and Abstracts Views on Vision4Press platform.
Data correspond to usage on the plateform after 2015. The current usage metrics is available 48-96 hours after online publication and is updated daily on week days.
Initial download of the metrics may take a while.