Free Access
Fig. C.1
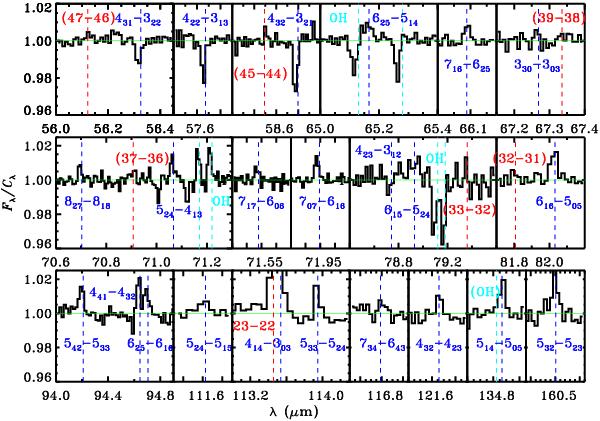
Close-ups of several of the H2O, CO and OH lines in W3IRS5 as shown in Fig. 1. The rest wavelength of each line is indicated by dashed lines: blue for H2O, red for CO, and light blue for OH. Identifications of the undetected lines in the presented spectral regions are shown in parenthesis.
Current usage metrics show cumulative count of Article Views (full-text article views including HTML views, PDF and ePub downloads, according to the available data) and Abstracts Views on Vision4Press platform.
Data correspond to usage on the plateform after 2015. The current usage metrics is available 48-96 hours after online publication and is updated daily on week days.
Initial download of the metrics may take a while.