| Issue |
A&A
Volume 560, December 2013
|
|
|---|---|---|
| Article Number | A106 | |
| Number of page(s) | 27 | |
| Section | Stellar atmospheres | |
| DOI | https://doi.org/10.1051/0004-6361/201322336 | |
| Published online | 16 December 2013 | |
Online material
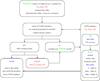 |
Fig. 1
Flow diagram of TheoSSA. The VO user sends an SED request to the GAVO database by entering the photospheric parameters. If a suitable model is available within the desired tolerance limits, it is offered as a results table. In case that the parameters are not exactly matched, the VO user may decide to calculate a model with the exact parameters. TMAW will start a model-atmosphere calculation at our institute’s (IAAT) PC cluster then. Extended model grids make use of computer resources that are provided by AstroGrid-D. As soon as the model is converged, the VO user can retrieve the SED table from the GAVO database. |
| Open with DEXTER | |
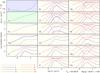 |
Fig. 6
Temperature and density structure and ionizations fractions of our model with and log g = 7.60. IG denotes a generic model atom consisting of Ca, Sc, Ti, V, Cr, Mn, and Co. |
| Open with DEXTER | |
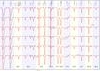 |
Fig. 10
Synthetic line profiles of C iii– iv, N iii– v, Si iii– iv, P iv– v, S iv– v, and Ge iv– v calculated from models with 57 000 K ≤ Teff ≤ 62 000 K and log g = 7.6 compared with FUSE and STIS observations. The small horizontal bars, labeled with the element’s name, indicate Teff where the ionization balance is best reproduced. The lines are identified at the top. “is” denotes interstellar origin. In the cases of C iv λλ 1548,1550 Å, C iv λλ 1548,1550 Å, and Si iii λλ 1206.500,1206.555 Å, the photospheric line profile is shown by a dashed, blue line (for the model at the top only). |
| Open with DEXTER | |
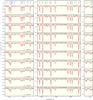 |
Fig. 11
Same as Fig. 10 for Fe iv– vi lines (from left to right panels, marked blue in the top panels) only. |
| Open with DEXTER | |
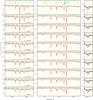 |
Fig. 12
Same as Fig. 10 for Ni iv– vi lines (from left to right panels, marked green in the top panels) only. |
| Open with DEXTER | |
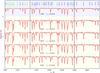 |
Fig. 23
Comparison of our model spectra (all calculated with log g = 7.60) with the STIS observation. Top: final homogeneous model (TMAP). The stratified NGRT models have Teff = 65 000 K, 60 000 K, 55 000 K, and 50 000 K (from top to bottom). The lines in the models are marked. |
| Open with DEXTER | |
Statistics of our model atoms.
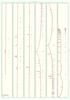 |
Fig. A.1
Comparison of the FUSE observation with our final model. Stellar and interstellar lines are identified. “is” denotes interstellar origin, “unid.” denotes unidentified lines. |
| Open with DEXTER | |
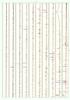 |
Fig. A.2
Comparison of a section of the STIS observation with our final model. Stellar and interstellar lines are identified. “is” denotes interstellar origin, “unid.” denotes unidentified lines. |
| Open with DEXTER | |
© ESO, 2013
Current usage metrics show cumulative count of Article Views (full-text article views including HTML views, PDF and ePub downloads, according to the available data) and Abstracts Views on Vision4Press platform.
Data correspond to usage on the plateform after 2015. The current usage metrics is available 48-96 hours after online publication and is updated daily on week days.
Initial download of the metrics may take a while.