| Issue |
A&A
Volume 559, November 2013
|
|
|---|---|---|
| Article Number | A51 | |
| Number of page(s) | 33 | |
| Section | Interstellar and circumstellar matter | |
| DOI | https://doi.org/10.1051/0004-6361/201322073 | |
| Published online | 11 November 2013 | |
Online material
Appendix A: Figures and tables
HC3N parameters from Gaussian fits.
Lines of DC3N with emission frequencies whithin the 30-m IRAM survey.
Observed lines of HC5N.
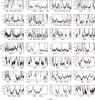 |
Fig. A.1
Observed spectra (black histogram) in the HIFI survey. Best-fit LTE model results for HC3N ν7 are shown in red. |
| Open with DEXTER | |
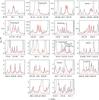 |
Fig. A.2
Observed lines of HC3N 2ν7 (black histogram) in the IRAM survey. Best-fit LTE model results are shown in red. |
| Open with DEXTER | |
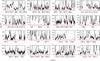 |
Fig. A.3
Observed spectra (black histogram) in the HIFI survey. Best-fit LTE model results for HC3N 2ν7 are shown in red. |
| Open with DEXTER | |
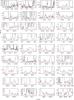 |
Fig. A.4
Observed lines of HC3N 3ν7 (black histogram) in the IRAM survey. Best-fit LTE model results are shown in red. |
| Open with DEXTER | |
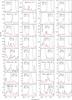 |
Fig. A.5
Detected lines of HC3N ν5 (black histogram) in the IRAM survey. Best-fit LTE model results are shown in red. |
| Open with DEXTER | |
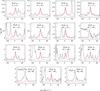 |
Fig. A.6
Observed lines of HC3N ν6 (black histogram) in the IRAM survey. Best-fit LTE model results are shown in red. |
| Open with DEXTER | |
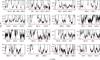 |
Fig. A.7
Observed spectra (black histogram) in the HIFI survey. Best-fit LTE model results for HC3N ν5 are shown in red. |
| Open with DEXTER | |
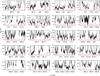 |
Fig. A.8
Observed spectra (black histogram) in the HIFI survey. Best-fit LTE model results for HC3N ν6 are shown in red. |
| Open with DEXTER | |
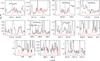 |
Fig. A.9
Observed lines of HC3N ν6 + ν7 (black histogram) in the IRAM survey. Best-fit LTE model results are shown in red. |
| Open with DEXTER | |
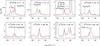 |
Fig. A.10
Observed lines of H13CCCN (black histogram) in the IRAM survey. Best-fit LVG model results are shown in red. |
| Open with DEXTER | |
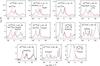 |
Fig. A.11
Observed lines of HC13CCN (black histogram) in the IRAM survey. Best-fit LVG model results are shown in red. |
| Open with DEXTER | |
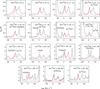 |
Fig. A.12
Observed lines of HCC13CN (black histogram) in the IRAM survey. Best-fit LVG model results are shown in red. |
| Open with DEXTER | |
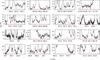 |
Fig. A.13
Observed spectra (black histogram) in the HIFI survey. Best-fit LVG model results for H13CCCN are shown in red. |
| Open with DEXTER | |
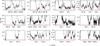 |
Fig. A.14
Observed spectra (black histogram) in the HIFI survey. Best-fit LVG model results for HC13CCN are shown in red. |
| Open with DEXTER | |
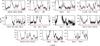 |
Fig. A.15
Observed spectra (black histogram) in the HIFI survey. Best-fit LVG model results for HCC13CN are shown in red. |
| Open with DEXTER | |
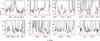 |
Fig. A.16
Observed lines of H13CCCN ν7 (black histogram) in the IRAM survey. Best-fit LTE model results are shown in red. |
| Open with DEXTER | |
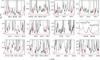 |
Fig. A.17
Observed lines of HC13CCN ν7 (black histogram) in the IRAM survey. Best-fit LTE model results are shown in red. |
| Open with DEXTER | |
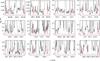 |
Fig. A.18
Observed lines of HCC13CN ν7 (black histogram) in the IRAM survey. Best-fit LTE model results are shown in red. |
| Open with DEXTER | |
© ESO, 2013
Current usage metrics show cumulative count of Article Views (full-text article views including HTML views, PDF and ePub downloads, according to the available data) and Abstracts Views on Vision4Press platform.
Data correspond to usage on the plateform after 2015. The current usage metrics is available 48-96 hours after online publication and is updated daily on week days.
Initial download of the metrics may take a while.