| Issue |
A&A
Volume 559, November 2013
|
|
|---|---|---|
| Article Number | A83 | |
| Number of page(s) | 20 | |
| Section | Planets and planetary systems | |
| DOI | https://doi.org/10.1051/0004-6361/201220770 | |
| Published online | 20 November 2013 | |
Online material
Appendix A: Observed RV, BVS, and measured detection limits
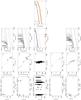 |
Fig. A.1
From left to right: 1) RV time series. 2) (RV, BVS) diagramme. The slope of the (RV, BVS) correlation is indicated. In a few cases, the value is obviously impacted by a single deviating data point. 3) rms-based detection limits with a 99.8% probability (solid black curve) and a 68.2% probability (dotted curve), achievable limits with a perfect sampling (black solid straight line) and achievable limits if the signal was limited only by photon and instrumental noises and with a perfect temporal sampling (dotted straight lines). The vertical lines in the (period, detection limit) diagramme indicate the timespan for each star. 4) detection limits obtained with the LPA method. “r” indicates the factor of improvement between the LPA and rms-based detection limits. |
| Open with DEXTER | |
 |
Fig. A.1
continued. |
| Open with DEXTER | |
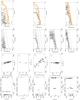 |
Fig. A.1
continued. |
| Open with DEXTER | |
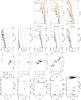 |
Fig. A.1
continued. |
| Open with DEXTER | |
 |
Fig. A.1
continued. |
| Open with DEXTER | |
 |
Fig. A.1
continued. |
| Open with DEXTER | |
 |
Fig. B.1
First column: RV versus time of a simulated equatorial spot covering 1.5% of the visible surface and a temperature contrast of 1200 K, for a seen edge-on sun-like star and for five different values of vsini from the upper panels to the lower panels: 3 km s-1, 10 km s-1, 30 km s-1, 50 km s-1, 80 km s-1. Second column: same for the bissectors. Third column: BVS versus RV. Fourth column: BVS versus time. |
| Open with DEXTER | |
 |
Fig. B.2
Same as Fig. 10 for an inclination of 30 degrees (three first lines) and 5 degrees (three last lines), a colatitude (from the pole) of 30 degrees (except 5th line with a colatitude of 60 degrees), and vsini (from upper panels to lower panels) of 3, 10, 40, 10, 10, and 10 km s-1. |
| Open with DEXTER | |
© ESO, 2013
Current usage metrics show cumulative count of Article Views (full-text article views including HTML views, PDF and ePub downloads, according to the available data) and Abstracts Views on Vision4Press platform.
Data correspond to usage on the plateform after 2015. The current usage metrics is available 48-96 hours after online publication and is updated daily on week days.
Initial download of the metrics may take a while.