Fig. A.1
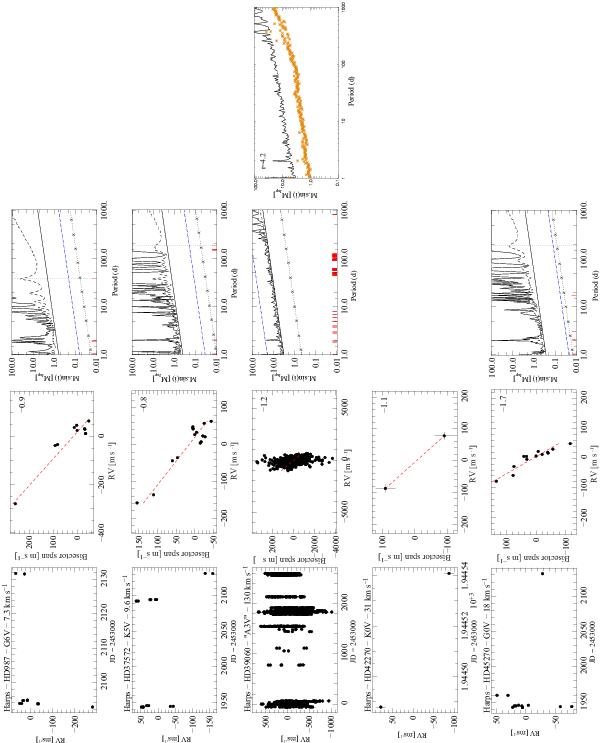
From left to right: 1) RV time series. 2) (RV, BVS) diagramme. The slope of the (RV, BVS) correlation is indicated. In a few cases, the value is obviously impacted by a single deviating data point. 3) rms-based detection limits with a 99.8% probability (solid black curve) and a 68.2% probability (dotted curve), achievable limits with a perfect sampling (black solid straight line) and achievable limits if the signal was limited only by photon and instrumental noises and with a perfect temporal sampling (dotted straight lines). The vertical lines in the (period, detection limit) diagramme indicate the timespan for each star. 4) detection limits obtained with the LPA method. “r” indicates the factor of improvement between the LPA and rms-based detection limits.
Current usage metrics show cumulative count of Article Views (full-text article views including HTML views, PDF and ePub downloads, according to the available data) and Abstracts Views on Vision4Press platform.
Data correspond to usage on the plateform after 2015. The current usage metrics is available 48-96 hours after online publication and is updated daily on week days.
Initial download of the metrics may take a while.