| Issue |
A&A
Volume 556, August 2013
|
|
|---|---|---|
| Article Number | A68 | |
| Number of page(s) | 23 | |
| Section | Extragalactic astronomy | |
| DOI | https://doi.org/10.1051/0004-6361/201220969 | |
| Published online | 30 July 2013 | |
Online material
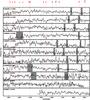 |
Fig. 2
Spectra of the reliable He II emitters with narrow He II emission (FWHM < 1000 km s-1). The grey bands show regions of the spectra that are contaminated by strong skylines or zero orders. We also report for each galaxy the id, the velocity difference between the He II and the systemic redshift, the width (FWHM) of the He II line, and the systemic redshift. |
| Open with DEXTER | |
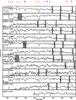 |
Fig. 3
Spectra of the reliable He II emitters with broad He II emission (FWHM > 1800 km s-1). The grey bands show regions of the spectra that are contaminated by strong skylines or zero orders. We also report for each galaxy the id, the velocity difference between the He II and the systemic redshift, the width (FWHM) of the He II line, and the systemic redshift. |
| Open with DEXTER | |
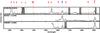 |
Fig. 4
Spectra of the AGN with He II emission. The grey bands show regions of the spectra that are contaminated by strong skylines or zero orders. We also report for each galaxy the id, the velocity difference between the He II and the systemic redshift, the width (FWHM) of the He II line, and the systemic redshift. |
| Open with DEXTER | |
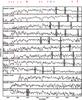 |
Fig. 5
Spectra of the possible He II emitters. The grey bands show regions of the spectra that are contaminated by strong skylines or zero orders. We also report for each galaxy the id, the velocity difference between the He II and the systemic redshift, the width (FWHM) of the He II line, and the systemic redshift. |
| Open with DEXTER | |
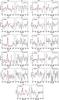 |
Fig. 6
Close-up of the region around He II (left side of each sub-figure) and around CIV (right side of each sub-figure) for each of the narrow He II emitters. In the pairs of panels, the red line shows a Gaussian fit to either He II or CIV. When a single Gaussian is not enough to reproduce the CIV absorption, we add a second Gaussian in emission (shown in blue); the resulting profile, mimicking a P-Cygni profile, is shown in green. The number in the right-side panels is the ratio between the flux of the C IV component in emission and the flux of He II. |
| Open with DEXTER | |
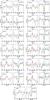 |
Fig. 7
Close-up of the region around He II (left side of each sub-figure) and around CIV (right side of each sub-figure) for each of the broad He II emitters. In the pairs of panels, the red line shows a Gaussian fit to either He II or CIV. When a single Gaussian is not enough to reproduce the CIV absorption, we add a second Gaussian in emission (shown in blue); the resulting profile, mimicking a P-Cygni profile, is shown in green. The number in the right-side panels is the ratio between the flux of the C IV component in emission and the flux of He II. |
| Open with DEXTER | |
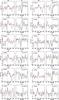 |
Fig. 8
Close-up of the region around He II (left side of each sub-figure) and around CIV (right side of each sub-figure) for each of the probable He II emitters. In the pairs of panels, the red line shows a Gaussian fit to either He II or CIV. When a single Gaussian is not enough to reproduce the CIV absorption, we add a second Gaussian in emission (shown in blue); the resulting profile, mimicking a P-Cygni profile, is shown in green. The number in the right-side panels is the ratio between the flux of the C IV component in emission and the flux of He II. |
| Open with DEXTER | |
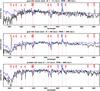 |
Fig. 12
Stack of the individual spectra for the reliable galaxies with narrow He II emission (top), the reliable galaxies with broad He II emission (middle), and the possible He II emitters (bottom). The blue lines show models obtained combining the predictions for a burst of star formation by Maraston et al. (2009) with the predictions for a Wolf-Rayet phase by Eldrige & Stanway (2012). As explained in the text, they are not an attempt of fitting the composite spectra with models, but rather are aimed at comparing some spectral features in the composite spectra with the models. |
| Open with DEXTER | |
© ESO, 2013
Current usage metrics show cumulative count of Article Views (full-text article views including HTML views, PDF and ePub downloads, according to the available data) and Abstracts Views on Vision4Press platform.
Data correspond to usage on the plateform after 2015. The current usage metrics is available 48-96 hours after online publication and is updated daily on week days.
Initial download of the metrics may take a while.