Fig. 12
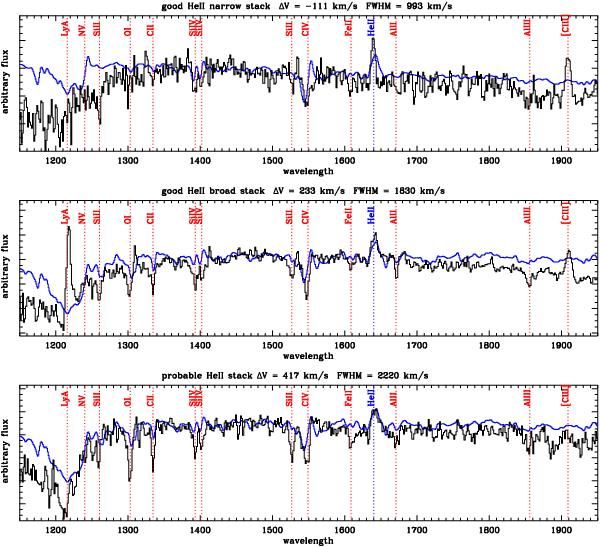
Stack of the individual spectra for the reliable galaxies with narrow He II emission (top), the reliable galaxies with broad He II emission (middle), and the possible He II emitters (bottom). The blue lines show models obtained combining the predictions for a burst of star formation by Maraston et al. (2009) with the predictions for a Wolf-Rayet phase by Eldrige & Stanway (2012). As explained in the text, they are not an attempt of fitting the composite spectra with models, but rather are aimed at comparing some spectral features in the composite spectra with the models.
Current usage metrics show cumulative count of Article Views (full-text article views including HTML views, PDF and ePub downloads, according to the available data) and Abstracts Views on Vision4Press platform.
Data correspond to usage on the plateform after 2015. The current usage metrics is available 48-96 hours after online publication and is updated daily on week days.
Initial download of the metrics may take a while.