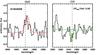
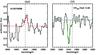
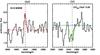
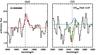
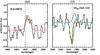
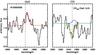
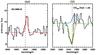
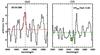
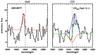
Fig. 8
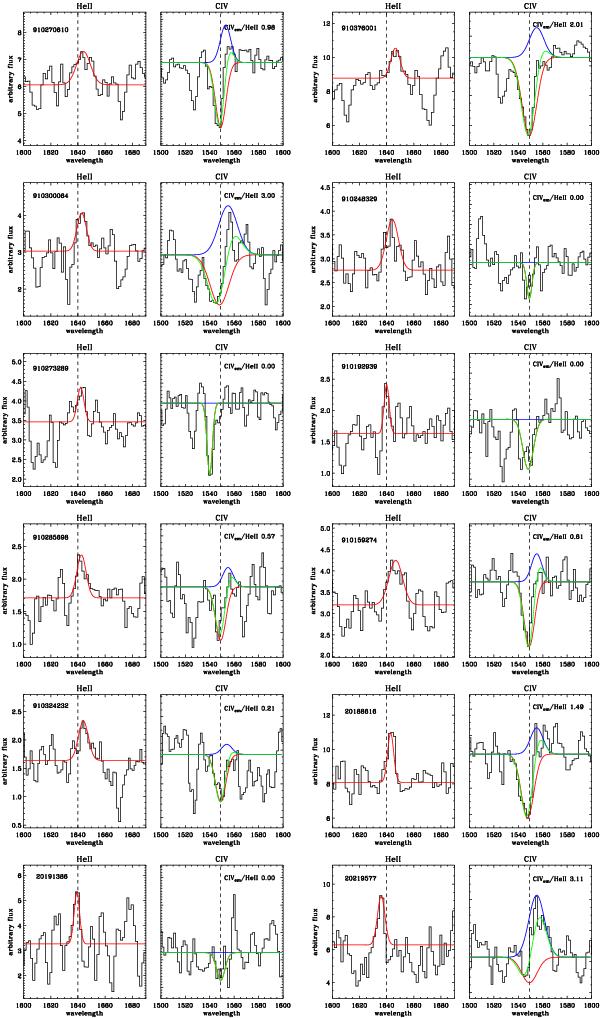
Close-up of the region around He II (left side of each sub-figure) and around CIV (right side of each sub-figure) for each of the probable He II emitters. In the pairs of panels, the red line shows a Gaussian fit to either He II or CIV. When a single Gaussian is not enough to reproduce the CIV absorption, we add a second Gaussian in emission (shown in blue); the resulting profile, mimicking a P-Cygni profile, is shown in green. The number in the right-side panels is the ratio between the flux of the C IV component in emission and the flux of He II.
Current usage metrics show cumulative count of Article Views (full-text article views including HTML views, PDF and ePub downloads, according to the available data) and Abstracts Views on Vision4Press platform.
Data correspond to usage on the plateform after 2015. The current usage metrics is available 48-96 hours after online publication and is updated daily on week days.
Initial download of the metrics may take a while.