| Issue |
A&A
Volume 554, June 2013
|
|
|---|---|---|
| Article Number | A83 | |
| Number of page(s) | 34 | |
| Section | Interstellar and circumstellar matter | |
| DOI | https://doi.org/10.1051/0004-6361/201220976 | |
| Published online | 07 June 2013 | |
Online material
Appendix A: Observation log and line flux tables
List of observations.
Central velocities, FWHM widths, and integrated line fluxes measured for the protostellar envelopes.
Appendix B: Observed line profiles
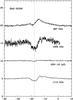 |
Fig. B.1
Spectra of the H2O 111 − 000 (bottom), H |
| Open with DEXTER | |

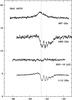 |
Fig. B.2
As Fig. B.1, toward IRAS 16272. |
| Open with DEXTER | |
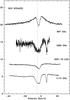 |
Fig. B.3
As Fig. B.1, toward NGC 6334I(N). |
| Open with DEXTER | |
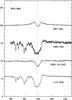 |
Fig. B.4
As Fig. B.1, toward W43 MM1. |
| Open with DEXTER | |
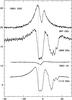 |
Fig. B.5
As Fig. B.1, toward DR21(OH). |
| Open with DEXTER | |
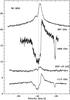 |
Fig. B.6
As Fig. B.1, toward W3 IRS5. |
| Open with DEXTER | |
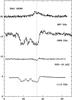 |
Fig. B.7
As Fig. B.1, toward IRAS 18089. |
| Open with DEXTER | |
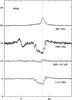 |
Fig. B.8
As Fig. B.1, toward W33A. The emission/absorption feature near 0 km s-1 in the 1669 GHz spectrum is the H2O 1661 GHz line from the other sideband. |
| Open with DEXTER | |
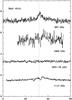 |
Fig. B.9
As Fig. B.1, toward IRAS 18151. |
| Open with DEXTER | |
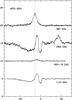 |
Fig. B.10
As Fig. B.1, toward AFGL 2591. The emission feature near +18 km s-1 in the 1669 GHz spectrum is the H2O 1661 GHz line from the other sideband. |
| Open with DEXTER | |
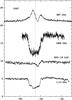 |
Fig. B.11
As Fig. B.1, toward G 327. |
| Open with DEXTER | |
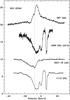 |
Fig. B.12
As Fig. B.1, toward NGC 6334I. |
| Open with DEXTER | |
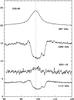 |
Fig. B.13
As Fig. B.1, toward G29.96. |
| Open with DEXTER | |
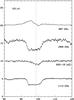 |
Fig. B.14
As Fig. B.1, toward G31.41. |
| Open with DEXTER | |
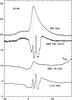 |
Fig. B.15
As Fig. B.1, toward G5.89. The emission feature near +90 km s-1 in the H |
| Open with DEXTER | |
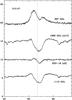 |
Fig. B.16
As Fig. B.1, toward G10.47. |
| Open with DEXTER | |
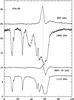 |
Fig. B.17
As Fig. B.1, toward G34.26. |
| Open with DEXTER | |
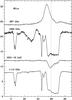 |
Fig. B.18
As Fig. B.1, toward W51e. |
| Open with DEXTER | |
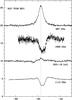 |
Fig. B.19
As Fig. B.1, toward NGC 7538 IRS1. |
| Open with DEXTER | |
Appendix C: Continuum models
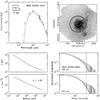 |
Fig. C.1
Continuum model for IRAS 05358. Top left: spectral energy distribution. Top right: submillimeter image with 3σ contour marked in white and useable map sectors marked in black. Bottom left: temperature and density structure as a function of radius. Bottom right: submillimeter emission profiles. The numbers in the top left panel are the modeled envelope mass, the modeled luminosity, the adopted envelope size and the adopted distance. |
| Open with DEXTER | |
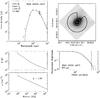 |
Fig. C.2
As Fig. C.1, for IRAS 16272. |
| Open with DEXTER | |
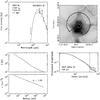 |
Fig. C.3
As Fig. C.1, for NGC 6334I(N). |
| Open with DEXTER | |
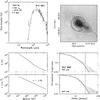 |
Fig. C.4
As Fig. C.1, for W43-MM1. |
| Open with DEXTER | |
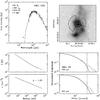 |
Fig. C.5
As Fig. C.1, for DR21(OH). |
| Open with DEXTER | |
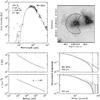 |
Fig. C.6
As Fig. C.1, for W3 IRS5. |
| Open with DEXTER | |
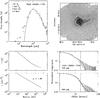 |
Fig. C.7
As Fig. C.1, for IRAS 18089. |
| Open with DEXTER | |
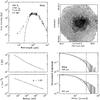 |
Fig. C.8
As Fig. C.1, for W33A. |
| Open with DEXTER | |
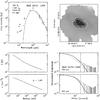 |
Fig. C.9
As Fig. C.1, for IRAS 18151. |
| Open with DEXTER | |
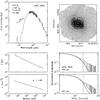 |
Fig. C.10
As Fig. C.1, for AFGL 2591. |
| Open with DEXTER | |
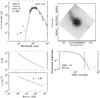 |
Fig. C.11
As Fig. C.1, for G327–0.6. |
| Open with DEXTER | |
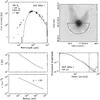 |
Fig. C.12
As Fig. C.1, for NGC 6334I. |
| Open with DEXTER | |
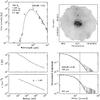 |
Fig. C.13
As Fig. C.1, for G29.96. |
| Open with DEXTER | |
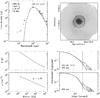 |
Fig. C.14
As Fig. C.1, for G31.41. |
| Open with DEXTER | |
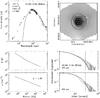 |
Fig. C.15
As Fig. C.1, for G5.89. |
| Open with DEXTER | |
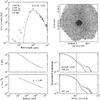 |
Fig. C.16
As Fig. C.1, for G10.47. |
| Open with DEXTER | |
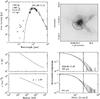 |
Fig. C.17
As Fig. C.1, for G34.26. |
| Open with DEXTER | |
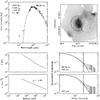 |
Fig. C.18
As Fig. C.1, for W51e. |
| Open with DEXTER | |
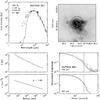 |
Fig. C.19
As Fig. C.1, for NGC 7538 IRS1. |
| Open with DEXTER | |
Appendix D: Correlation analysis
 |
Fig. D.1
Observed line fluxes (positive: emission) or absorbances (negative: absorption) versus bolometric luminosity L of the source (top), versus envelope mass M (middle), and versus the ratio L/M (bottom). Open squares: mid-IR-quiet HMPOs; filled squares: mid-IR-bright HMPOs; triangles: hot molecular cores; circles: ultracompact Hii regions. Uncertainties in line fluxes are ≈10%, while the typical uncertainty of masses, luminosities and L/M ratios is a factor of 2. |
| Open with DEXTER | |
 |
Fig. D.2
As Fig. D.1, for the narrow outflow component. |
| Open with DEXTER | |
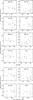 |
Fig. D.3
As Fig. D.1, for the broad outflow component. |
| Open with DEXTER | |
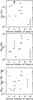 |
Fig. D.4
Line width of the narrow outflow component versus bolometric luminosity L of the source (top), versus envelope mass M (middle), and versus the ratio L/M (bottom). The error bar denotes the typical uncertainty in mass, luminosity, and L/M ratio; the uncertainty in line width is smaller than the symbol size. |
| Open with DEXTER | |
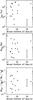 |
Fig. D.5
As Fig. D.4, for the broad outflow component. |
| Open with DEXTER | |
© ESO, 2013
Current usage metrics show cumulative count of Article Views (full-text article views including HTML views, PDF and ePub downloads, according to the available data) and Abstracts Views on Vision4Press platform.
Data correspond to usage on the plateform after 2015. The current usage metrics is available 48-96 hours after online publication and is updated daily on week days.
Initial download of the metrics may take a while.