Fig. C.1
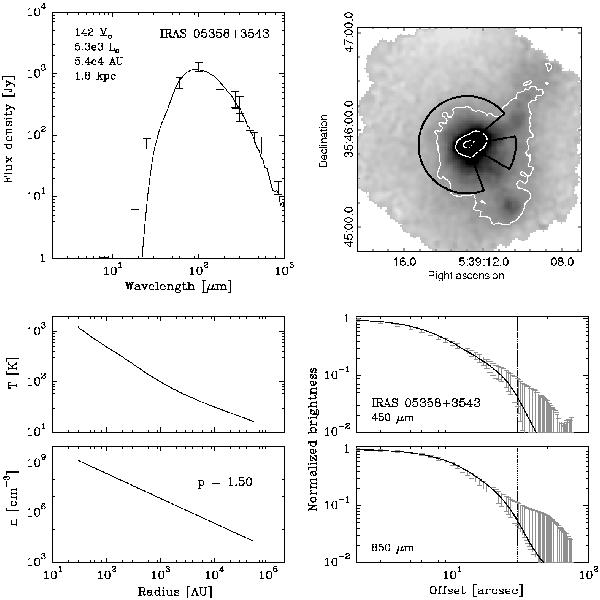
Continuum model for IRAS 05358. Top left: spectral energy distribution. Top right: submillimeter image with 3σ contour marked in white and useable map sectors marked in black. Bottom left: temperature and density structure as a function of radius. Bottom right: submillimeter emission profiles. The numbers in the top left panel are the modeled envelope mass, the modeled luminosity, the adopted envelope size and the adopted distance.
Current usage metrics show cumulative count of Article Views (full-text article views including HTML views, PDF and ePub downloads, according to the available data) and Abstracts Views on Vision4Press platform.
Data correspond to usage on the plateform after 2015. The current usage metrics is available 48-96 hours after online publication and is updated daily on week days.
Initial download of the metrics may take a while.