Fig. B.1
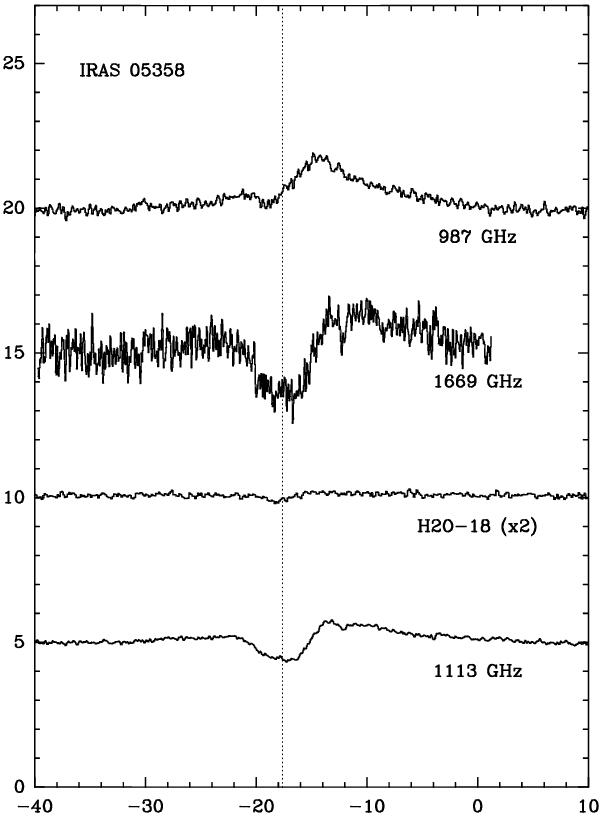
Spectra of the H2O 111 − 000 (bottom), H O 111 − 000 (second from bottom), H2O 212–101 (third from bottom) and H2O 202–111 (top) lines toward IRAS 05358. The vertical scale is Tmb in K, and the dashed line denotes the systemic velocity determined from ground-based observations. The spectra have been shifted vertically for clarity.
Current usage metrics show cumulative count of Article Views (full-text article views including HTML views, PDF and ePub downloads, according to the available data) and Abstracts Views on Vision4Press platform.
Data correspond to usage on the plateform after 2015. The current usage metrics is available 48-96 hours after online publication and is updated daily on week days.
Initial download of the metrics may take a while.