| Issue |
A&A
Volume 551, March 2013
|
|
|---|---|---|
| Article Number | A97 | |
| Number of page(s) | 39 | |
| Section | Extragalactic astronomy | |
| DOI | https://doi.org/10.1051/0004-6361/201220374 | |
| Published online | 04 March 2013 | |
Online material
Data of the 217 sources which were in principle detectable (SVLA > 6 × rms).
Multi-wavelength data for the VLBI-detected sources.
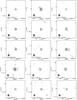 |
Fig. 21
Contour plots of the VLBA images of the 65 detected sources. The plots show
regions of 216 mas × 216 mas, centred on the sources, except for the plot of
L0703, which shows a region of 360 mas × 360 mas. Black contours indicate the
full-resolution, naturally-weighted images, whereas grey, dashed contours indicate
images made with a 10 Mλ taper. The black and grey ellipses in
the lower left corners indicate the size and orientation of the restoring beams
used with full resolution and a 10 Mλ taper, respectively. In
both cases contours start at the 3 times the naturally-weighted image noise and
increase by factors of |
| Open with DEXTER | |

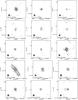 |
Fig. 21
continued. |
| Open with DEXTER | |
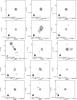 |
Fig. 21
continued. |
| Open with DEXTER | |
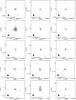 |
Fig. 21
continued. |
| Open with DEXTER | |
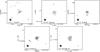 |
Fig. 21
continued. |
| Open with DEXTER | |
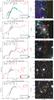 |
Fig. 22
Left column: UV to mid-infrared SED fits. Black points: photometric observations, red line: best-fitting model, cyan line: stellar template, black line (where applicable): galaxy template of second photometric redshift solution. The inset shows the probability distribution function of the best-fit model. Right column: RGB cutouts made from Subaru RcIcz′ images, with a single VLA contour overlaid and the VLBA position indicated with red crosses. These images show regions 28.8 arcsec × 28.8 arcsec in size. |
| Open with DEXTER | |
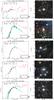 |
Fig. 22
continued. |
| Open with DEXTER | |
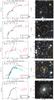 |
Fig. 22
continued. |
| Open with DEXTER | |
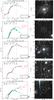 |
Fig. 22
continued. |
| Open with DEXTER | |
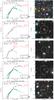 |
Fig. 22
continued. |
| Open with DEXTER | |
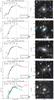 |
Fig. 22
continued. |
| Open with DEXTER | |
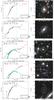 |
Fig. 22
continued. |
| Open with DEXTER | |
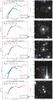 |
Fig. 22
continued. |
| Open with DEXTER | |
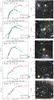 |
Fig. 22
continued. |
| Open with DEXTER | |
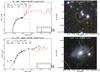 |
Fig. 22
continued. |
| Open with DEXTER | |
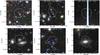 |
Fig. 23
RGB images of sources with uncatalogued, blended, or otherwise unavailable counterparts, made using the same settings as used for Fig. 22. In L0199, L0251, L0386 and L0708 very faint, but uncatalogued counterparts can be seen in the images; in L0506 and L1148 the VLBA detection is offset from the foreground object by so much that an association was deemed unlikely. |
| Open with DEXTER | |
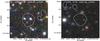 |
Fig. 24
RGB images of sources with no visible counterparts, made using the same settings as used for Fig. 22. |
| Open with DEXTER | |
© ESO, 2013
Current usage metrics show cumulative count of Article Views (full-text article views including HTML views, PDF and ePub downloads, according to the available data) and Abstracts Views on Vision4Press platform.
Data correspond to usage on the plateform after 2015. The current usage metrics is available 48-96 hours after online publication and is updated daily on week days.
Initial download of the metrics may take a while.