Fig. 21
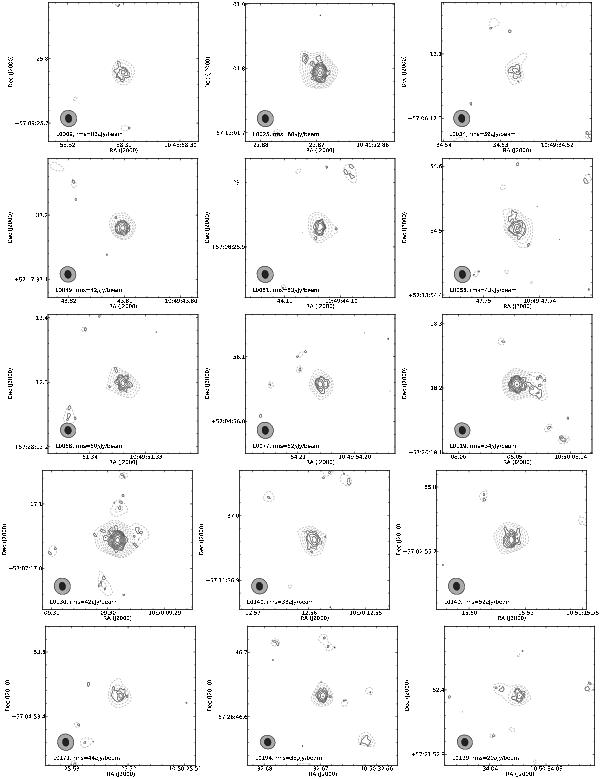
Contour plots of the VLBA images of the 65 detected sources. The plots show
regions of 216 mas × 216 mas, centred on the sources, except for the plot of
L0703, which shows a region of 360 mas × 360 mas. Black contours indicate the
full-resolution, naturally-weighted images, whereas grey, dashed contours indicate
images made with a 10 Mλ taper. The black and grey ellipses in
the lower left corners indicate the size and orientation of the restoring beams
used with full resolution and a 10 Mλ taper, respectively. In
both cases contours start at the 3 times the naturally-weighted image noise and
increase by factors of  .
The noise levels of the naturally weighted images have been added to the plots.
Note that the flux densities listed in Table 6 have been extracted from uniformly-weighted images (not shown), to
reduce the effect of the point spread function (see Sect. 4 and Fig. 10).
.
The noise levels of the naturally weighted images have been added to the plots.
Note that the flux densities listed in Table 6 have been extracted from uniformly-weighted images (not shown), to
reduce the effect of the point spread function (see Sect. 4 and Fig. 10).
Current usage metrics show cumulative count of Article Views (full-text article views including HTML views, PDF and ePub downloads, according to the available data) and Abstracts Views on Vision4Press platform.
Data correspond to usage on the plateform after 2015. The current usage metrics is available 48-96 hours after online publication and is updated daily on week days.
Initial download of the metrics may take a while.