Fig. 22
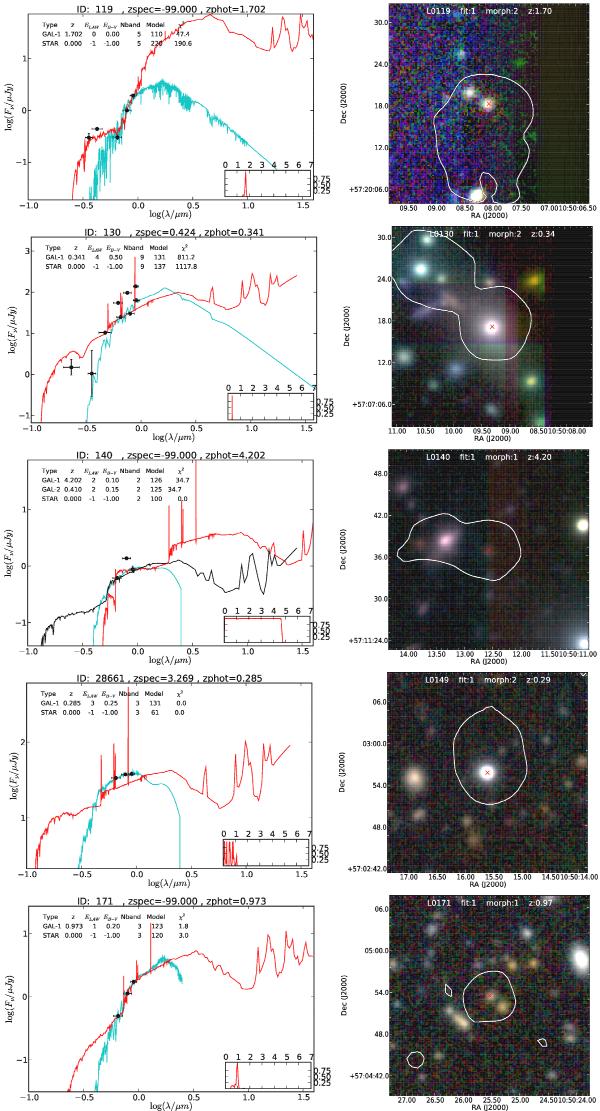
Left column: UV to mid-infrared SED fits. Black points: photometric observations, red line: best-fitting model, cyan line: stellar template, black line (where applicable): galaxy template of second photometric redshift solution. The inset shows the probability distribution function of the best-fit model. Right column: RGB cutouts made from Subaru RcIcz′ images, with a single VLA contour overlaid and the VLBA position indicated with red crosses. These images show regions 28.8 arcsec × 28.8 arcsec in size.
Current usage metrics show cumulative count of Article Views (full-text article views including HTML views, PDF and ePub downloads, according to the available data) and Abstracts Views on Vision4Press platform.
Data correspond to usage on the plateform after 2015. The current usage metrics is available 48-96 hours after online publication and is updated daily on week days.
Initial download of the metrics may take a while.