| Issue |
A&A
Volume 551, March 2013
|
|
|---|---|---|
| Article Number | A32 | |
| Number of page(s) | 30 | |
| Section | Extragalactic astronomy | |
| DOI | https://doi.org/10.1051/0004-6361/201219913 | |
| Published online | 14 February 2013 | |
Online material
Appendix A:
Here we show results of modeling for the individual frequencies (5 GHz − 43 GHz) during our multifrequency campaign (May 2005 until April 2007). For each frequency we present contour plots of the source, including the position of the fitted circular Gaussian components and its structural evolution during our observations. Furthermore, we show the temporal evolution of the component parameters, e.g., position, flux density and size, and the results of a polynomial fit to the cross identified features are summarized in Tables A.1–A.5. The component parameters for all frequencies and epochs can be found at the end of the Appendix in Tables A.6.
A.1. 5 GHz VLBI observations of CTA 102
Results of the kinematic analysis for the fitted components at 5 GHz.
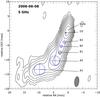 |
Fig. A.1
5 GHz uniformly weighted VLBA CLEAN image of CTA 102 observed on 8 June 2006 with fitted circular Gaussian components overlaid. The map peak flux density was 2.0 Jy/beam, where the convolving beam was 3.5 × 1.5 mas at PA − 5.3. The lowest contour is plotted at 10 × the off-source rms and increases in steps of 2. |
| Open with DEXTER | |
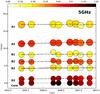 |
Fig. A.2
Temporal evolution of the separation from the core for the 5 GHz components. The color scale corresponds to the flux density and the size of the circles to the relative size (FWHM) of the components. The solid black lines correspond to a linear fits of the component trajectory. |
| Open with DEXTER | |
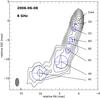 |
Fig. A.3
5 GHz uniform weighted VLBA images of CTA 102 with fitted circular Gaussian components. For better comparison all maps are convolved with a common beam of 3.5 × 1.6 mas at PA − 7.4 and the epoch of the observations is indicated above each contour map. The lowest contour levels is plotted 10 × of the maximum off-source rms and increases in steps of 2. |
| Open with DEXTER | |
A.2. 8 GHz VLBI observations of CTA 102
Results of the kinematic analysis for the fitted components at 8 GHz.
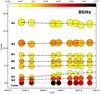 |
Fig. A.4
8 GHz uniformly weighted VLBA CLEAN image of CTA 102 observed on 8 June 2006 with fitted circular Gaussian components overlaid. The map peak flux density was 2.8 Jy/beam, where the convolving beam was 2.1 × 0.9 mas at PA − 0.9. The lowest contour is plotted at 10 × the off-source rms and increases in steps of 2. |
| Open with DEXTER | |
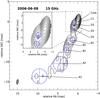 |
Fig. A.5
Temporal evolution of the separation from the core for the 8 GHz modeled features. The color scale corresponds to the flux density and the size of the circles to the relative size (FWHM) of the components. The solid black lines correspond to a linear fit of the component trajectory. |
| Open with DEXTER | |
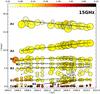 |
Fig. A.6
8 GHz uniform weighted VLBA images of CTA 102 with fitted circular Gaussian components. For better comparison all maps are convolved with a common beam of 2.1 × 1.1 mas at PA − 2.6 and the epoch of the observations is indicated above each contour map. The lowest contour levels is plotted 10 × of the maximum off-source rms and increases in steps of 2. |
| Open with DEXTER | |
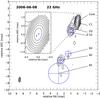 |
Fig. A.7
15 GHz uniformly weighted VLBA CLEAN image of CTA 102 observed on 8 June 2006 with fitted circular Gaussian components overlaid. The map peak flux density was 4.13 Jy/beam, where the convolving beam was 1.3 × 0.5 mas at PA − 6.2. The lowest contour is plotted at 10 × the off-source rms and increases in steps of 2. |
| Open with DEXTER | |
A.3. 15 GHz VLBI observations of CTA 102
Results of the kinematic analysis for the fitted components at 15 GHz.
 |
Fig. A.8
Temporal evolution of the separation from the core for the 15 GHz components from Lister et al. (2009a) and combined with our 15 GHz data. The color scale corresponds to the flux density and the size of the circles to the relative size (FWHM) of the components. The solid black lines correspond to a polynomial fit of the component trajectory. |
| Open with DEXTER | |
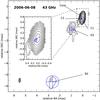 |
Fig. A.9
15 GHz uniform weighted VLBA images of CTA 102 with fitted circular Gaussian components. For better comparison all maps are convolved with a common beam of 1.2 × 0.6 mas at PA − 9.9 and the epoch of the observations is indicated above each contour map. The lowest contour levels is plotted 10 × of the maximum off-source rms and increases in steps of 2. Notice that the outermost component (A1) for each epoch is plotted as almost overlapping with the jet of the earlier epoch (to its left) in this representation. |
| Open with DEXTER | |
A.4. 22 GHz VLBI observations of CTA 102
Results of the kinematic analysis for the fitted components at 22 GHz.
 |
Fig. A.10
22 GHz uniformly weighted VLBA CLEAN image of CTA 102 with fitted circular Gaussian components observed 8th of June 2006 overlaid. The map peak flux density was 3.8 Jy/beam, where the convolving beam was 0.76 × 0.33 mas at PA − 6.2. he lowest contour is plotted at 10 × the off-source rms and increases in steps of 2. |
| Open with DEXTER | |
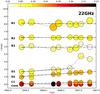 |
Fig. A.11
Temporal evolution of the separation from the core for the 22 GHz components. The color scale corresponds to the flux density and the size of the circles to the relative size (FWHM) of the components. The solid black lines correspond to a linear fit of the component trajectory. |
| Open with DEXTER | |
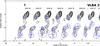 |
Fig. A.12
22 GHz uniform weighted VLBA images of CTA 102 with fitted circular Gaussian components. For better comparison all maps are convolved with a common beam of 0.8 × 0.4 mas at PA − 7.6 and the epoch of the observations is indicated above each contour map. The lowest contour levels is plotted 10 × of the maximum off-source rms and increases in steps of 2. |
| Open with DEXTER | |
A.5. 43 GHz VLBI observations of CTA 102
Results of the kinematic analysis for the fitted components at 43 GHz.
 |
Fig. A.13
43 GHz uniformly weighted VLBA image of CTA 102 with fitted circular Gaussian components observed 8th of June 2006. The map peak flux density was 3.61 Jy/beam, where the convolving beam was 0.39 × 0.19 mas at PA − 5.0. The lowest contour is plotted at 5 × the off-source rms and increases in steps of 2. |
| Open with DEXTER | |
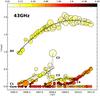 |
Fig. A.14
Temporal evolution of the separation from the core for the 43 GHz components. The color scale corresponds to the flux density and the size of the circles to the relative size (FWHM) of the components. The solid black lines correspond to a polynomial fit of the component trajectory. |
| Open with DEXTER | |
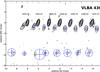 |
Fig. A.15
43 GHz uniform weighted VLBA images of CTA 102 with fitted circular Gaussian components. For better comparison all maps are convolved with a common beam of 0.5 × 0.2 mas at PA − 11.9 and the epoch of the observations is indicated above each contour map. The lowest contour levels is plotted 10 × of the maximum off-source rms and increases in steps of 2. |
| Open with DEXTER | |
Fitted components for multifrequency VLBI observations.
© ESO, 2013
Current usage metrics show cumulative count of Article Views (full-text article views including HTML views, PDF and ePub downloads, according to the available data) and Abstracts Views on Vision4Press platform.
Data correspond to usage on the plateform after 2015. The current usage metrics is available 48-96 hours after online publication and is updated daily on week days.
Initial download of the metrics may take a while.