Fig. A.15
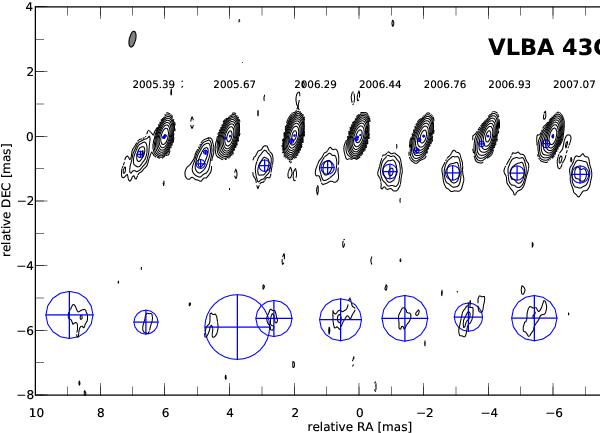
43 GHz uniform weighted VLBA images of CTA 102 with fitted circular Gaussian components. For better comparison all maps are convolved with a common beam of 0.5 × 0.2 mas at PA − 11.9 and the epoch of the observations is indicated above each contour map. The lowest contour levels is plotted 10 × of the maximum off-source rms and increases in steps of 2.
Current usage metrics show cumulative count of Article Views (full-text article views including HTML views, PDF and ePub downloads, according to the available data) and Abstracts Views on Vision4Press platform.
Data correspond to usage on the plateform after 2015. The current usage metrics is available 48-96 hours after online publication and is updated daily on week days.
Initial download of the metrics may take a while.