Free Access
Fig. A.11
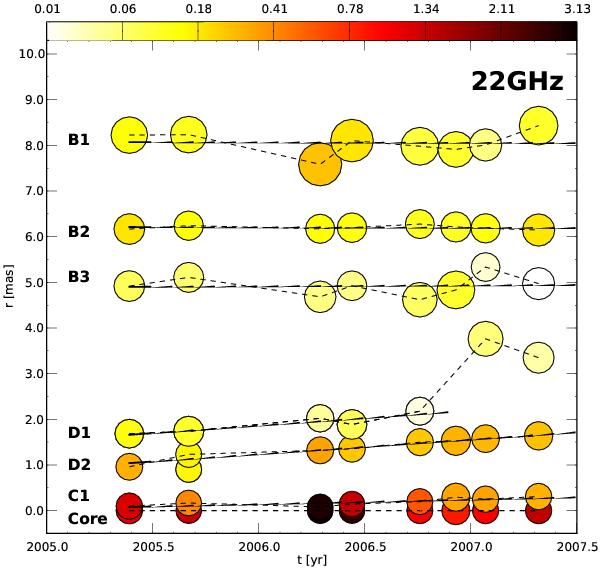
Temporal evolution of the separation from the core for the 22 GHz components. The color scale corresponds to the flux density and the size of the circles to the relative size (FWHM) of the components. The solid black lines correspond to a linear fit of the component trajectory.
Current usage metrics show cumulative count of Article Views (full-text article views including HTML views, PDF and ePub downloads, according to the available data) and Abstracts Views on Vision4Press platform.
Data correspond to usage on the plateform after 2015. The current usage metrics is available 48-96 hours after online publication and is updated daily on week days.
Initial download of the metrics may take a while.