| Issue |
A&A
Volume 550, February 2013
|
|
|---|---|---|
| Article Number | A37 | |
| Number of page(s) | 15 | |
| Section | Interstellar and circumstellar matter | |
| DOI | https://doi.org/10.1051/0004-6361/201219905 | |
| Published online | 23 January 2013 | |
Online material
Appendix A: Model analysis
A.1. Shell analysis
To analyze the discrepancy between the best-fit model based on the Rolffs physical profiles and the observed data for the two ground transitions (464 and 893 GHz), we first constrained the physical shells responsible for the emission and absorption features. To this end, we simulated new spectra by sequentially turning the abundance of HDO in the innermost shells to 0 (Fig. A.1). The jump around 0.02 pc is at the shell whose temperature is about 100 K (jump model) The green dashed line represents the model where the HDO abundance is zero in all inner regions of the core (model SH6). Figure A.2 presents the synthetic spectra obtained with these different models (SH1 – SH6). Obviously there is almost no emission in any spectrum with model SH6, suggesting that all emission, including the emission in the 893 GHz spectrum, is produced in the inner region of the core. Therefore, although loweringn the abundance in the inner region can help to reduce the emission in the 893 GHz line, it will also decrease the emission in other high-excitation lines (225, 241, and 266 GHz). On the other hand, the absorption in the 893 GHz spectrum is entirely produced in the outer region of the core and its line-width is wider than the observed one, implying that the assumed turbulent linewidth is wider than the observed one. Thus, we cannot adequately reproduce all spectra with the Rolffs original physical profiles.
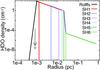 |
Fig. A.1
Original and modified molecular density profiles. The black line shows the original molecular density profile. Different colors indicate different molecular density profiles of models SH1 to SH6. |
| Open with DEXTER | |
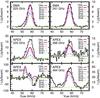 |
Fig. A.2
Comparison of the observed spectra with the results of 6 different shell models (Fig. A.1). Different colors indicate the simulated lines of models SH1 to SH6. The observed and simulated spectra at 241 GHz are very similar to the spectra at 225 GHz; therefore, only the spectra at 225 GHz are plotted here. |
| Open with DEXTER | |
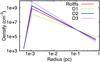 |
Fig. A.3
Comparison of the density profile of the three different modified models (blue, green, and pink) and original Rolffs’ model (red). |
| Open with DEXTER | |
A.2. Modified density profile
From previous test, it was found that the emission in the 893 GHz spectrum cannot be
managed by the Rolffs physical profiles, but only by changing the HDO abundance. We
therefore modified in the first place the density profile of the Rolffs model.
Figure A.3 compares the density profiles of
three different modified models and original the Rolffs model (red line). Here we
modified the density power law index (p), keeping the density at 0.1 pc fixed. The
indices are 1.1 for model D1 (green), 1.7 for model D2 (dark-blue), and 2 for model D3
(purple). Modifying the density profile has a direct impact on the distribution of the
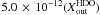
continuum emission. The comparison of the radial profiles of the continuum emission of
different models at multi-wavelength bands (225, 241, 335, and 848 GHz) is shown in
Fig. A.4. Ignoring the misfitting parts within
the beam (orange) and considering that free-free emission most likely also
significantly contributes to the continuum emission, model D1 and the Rolffs model
better reproduce the continuum emission in the 225 and 241 GHz bands than other
models. For the 335 and 848 GHz band, the Rolffs model and all modified models are
superior to the Nomura model. The best-fit results of each model are shown in
Fig. A.5 (model D1:
1.0 × 10⁻⁷(X and
and
 ; model D2:
 and
and
 ; model D3:
 and
and
 ). Comparing all spectra, we find that
model D3 produced intensity similar to the Rolffs model in high-excitation lines and
less emission in the 893 GHz line. However, the 464 and 893 GHz lines are optically
thicker (τ = 2.9 at 464 GHz and τ = 29.6 at 893 GHz)
than the lines produced by the Rolffs model. The high opacities result in
self-absorption in the 464 and 893 GHz spectra (less emission). Moreover, results (464
and 893 GHz spectra) simulated with models D1 and D2 are very similar to the results
produced with the original Rolffs model. Thus, we find that these models are not
significantly better than the original the Rolffs model. In other words, the fits
cannot be improved by simply modifying the density profile.
). Comparing all spectra, we find that
model D3 produced intensity similar to the Rolffs model in high-excitation lines and
less emission in the 893 GHz line. However, the 464 and 893 GHz lines are optically
thicker (τ = 2.9 at 464 GHz and τ = 29.6 at 893 GHz)
than the lines produced by the Rolffs model. The high opacities result in
self-absorption in the 464 and 893 GHz spectra (less emission). Moreover, results (464
and 893 GHz spectra) simulated with models D1 and D2 are very similar to the results
produced with the original Rolffs model. Thus, we find that these models are not
significantly better than the original the Rolffs model. In other words, the fits
cannot be improved by simply modifying the density profile.
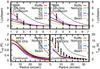 |
Fig. A.4
Radial profiles of the continuum emission at 225 (SMA), 241 (SMA), 356 (LABOCA, Rolffs et al. 2011), and 848 GHz (SABOCA, Wyrowski et al., in prep.) The modified models are overlaid in different colors (model D1 – green, D2 – dark-blue, and D3 – purple). The red and grey lines are reproduced profiles from the original Rolffs’ and Nomura’s models. The beam is shown as a orange dashed Gaussian. The errorbars represent only the deviation from a circular shape. |
| Open with DEXTER | |
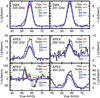 |
Fig. A.5
Comparison of the observed spectra with the best-fit results of 3 different models with modified density profiles (Fig. A.3). The red lines are the best-fit model of the original Rolffs profile. The observed and simulated spectra at 241 GHz are very similar to those at 225 GHz; therefore, only the spectra at 225 GHz are plotted here. |
| Open with DEXTER | |
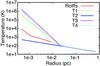 |
Fig. A.6
Comparison of the temperature profiles of the four different modified models (blue, green, light blue and purple) and the one of the original Rolffs model (red). |
| Open with DEXTER | |
A.3. Modified temperature profile
To decrease the emission in 893 GHz spectra and maintain the emission in high-excitation lines (225, 241, 266 GHz), modifying the temperature profile is a possible way. We increased the temperature in the very inner region (models T1, T3, and T4) of the core and decreased the fractional abundance in the inner region of the core. The modified and original temperature profiles are shown in Fig. A.6. Model T2 contrasts with other models.
Like for changing the density profile, modifying the temperature profile also influences the continuum emission. Figure A.7 compares the radial profiles of the continuum emission of different models in the four bands. Again, we find that the Rolffs model and all modified models are superior to the Nomura model in all bands. For the 225 and 241 GHz band, model T2 and the Rolffs model fit better, because the dust continuum is less than 25% of the total continuum flux, implying that increasing the temperature in the central region of the core is a poor solution. In the 335 and 848 GHz bands, T1, T2, and the Rolffs models are superior to others. The indistinguishable continuum at 848 GHz is due to a combination of optical depth and beam dilution effect: the temperature profile is changed only in the very central region of the core where the opacity is high and the beam size is much larger than the scale of the modified region (beam is ~7.4″ at 848 GHz and 2 × 10⁻² pc corresponds to ~1.1″). For 241 and 225 GHz, the angular resolution is sufficiently high and the opacity sufficiently low to detect the very inner region of the core.
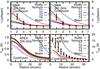 |
Fig. A.7
Same as Fig. A.4, but for the modified temperature models. |
| Open with DEXTER | |
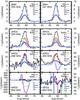 |
Fig. A.8
Comparison of the observed spectra and those reproduced with the fixed fractional abundances of models T1 to T4. The red lines are the best-fit model with the Rolffs original density profile. |
| Open with DEXTER | |
To compare the effect on the spectra, Fig. A.8
shows the fitting results of the different modified models with a fixed HDO fractional
abundance in the inner and outer region (X and
X
and
X ). The fitting spectra of the T1 and T4
models are similar to spectra of the Rolffs model in the high-excitation spectra at
225 and 241 GHz, while the T2 model produces less emission in all spectra. However,
models T1, T3, and T4 produce much poorer fits to the two ground-transition spectra,
and T2 already becomes optically thick (τ = 3.4) at 464 GHz. Hence,
simply modifying the temperature profiles does not improve the agreement between the
model and the observations.
). The fitting spectra of the T1 and T4
models are similar to spectra of the Rolffs model in the high-excitation spectra at
225 and 241 GHz, while the T2 model produces less emission in all spectra. However,
models T1, T3, and T4 produce much poorer fits to the two ground-transition spectra,
and T2 already becomes optically thick (τ = 3.4) at 464 GHz. Hence,
simply modifying the temperature profiles does not improve the agreement between the
model and the observations.
© ESO, 2013
Current usage metrics show cumulative count of Article Views (full-text article views including HTML views, PDF and ePub downloads, according to the available data) and Abstracts Views on Vision4Press platform.
Data correspond to usage on the plateform after 2015. The current usage metrics is available 48-96 hours after online publication and is updated daily on week days.
Initial download of the metrics may take a while.