Fig. A.5
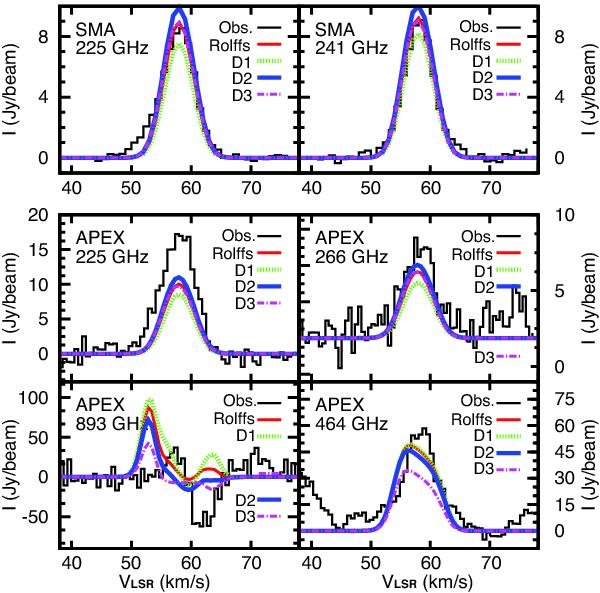
Comparison of the observed spectra with the best-fit results of 3 different models with modified density profiles (Fig. A.3). The red lines are the best-fit model of the original Rolffs profile. The observed and simulated spectra at 241 GHz are very similar to those at 225 GHz; therefore, only the spectra at 225 GHz are plotted here.
Current usage metrics show cumulative count of Article Views (full-text article views including HTML views, PDF and ePub downloads, according to the available data) and Abstracts Views on Vision4Press platform.
Data correspond to usage on the plateform after 2015. The current usage metrics is available 48-96 hours after online publication and is updated daily on week days.
Initial download of the metrics may take a while.