| Issue |
A&A
Volume 544, August 2012
|
|
|---|---|---|
| Article Number | A37 | |
| Number of page(s) | 28 | |
| Section | Extragalactic astronomy | |
| DOI | https://doi.org/10.1051/0004-6361/201218888 | |
| Published online | 26 July 2012 | |
Online material
Positions and magnitudes of the CDQs and the comparison stars∗.
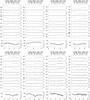 |
Fig. 1
The intranight optical DLCs of the LPCDQs monitored in the present study. For each night, the source name, the telescope used, the date, and the duration of monitoring are given at the top. The upper 3 panels show the DLCs of the LPCDQ relative to 3 comparison stars while the attached lower 3 panels show the star-star DLCs, where the solid horizontal lines mark the mean for each star-star DLC. The bottom panel gives the plots of seeing variation for the night, based on 3 stars monitored along with the blazar on the same CCD frame. |
| Open with DEXTER | |
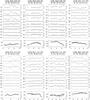 |
Fig. 1
continued. |
| Open with DEXTER | |
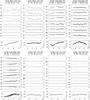 |
Fig. 1
continued. |
| Open with DEXTER | |
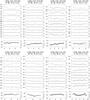 |
Fig. 1
continued. |
| Open with DEXTER | |
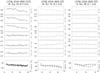 |
Fig. 1
continued. |
| Open with DEXTER | |
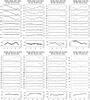 |
Fig. 2
The intranight optical DLCs of the HPCDQ monitored in the present study. For each night, the source name, the telescope used, the date, and the duration of monitoring are given at the top. The upper 3 panels show the DLCs of the HPCDQ relative to 3 comparison stars while the attached lower 3 panels show the star-star DLCs, where the solid horizontal lines mark the mean for each star-star DLC. The bottom panel gives the plots of seeing variation for the night, based on 3 stars monitored along with the blazar on the same CCD frame. |
| Open with DEXTER | |
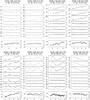 |
Fig. 2
continued. |
| Open with DEXTER | |
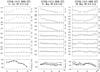 |
Fig. 2
continued. |
| Open with DEXTER | |
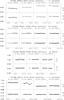 |
Fig. 3
Long-term optical variability (LTOV) DLCs for the LPCDQs monitored in the present study; source name and the total time span covered are at the top of each panel. |
| Open with DEXTER | |
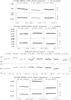 |
Fig. 3
continued. |
| Open with DEXTER | |
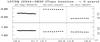 |
Fig. 3
continued. |
| Open with DEXTER | |
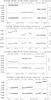 |
Fig. 4
As in Fig. 3 for the HPCDQs monitored in the present study. |
| Open with DEXTER | |
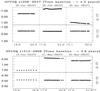 |
Fig. 4
continued. |
| Open with DEXTER | |
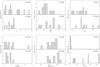 |
Fig. 6
Distributions of z, MB, αr, fc, Pext and Pop for our two sets of CDQs: LPCDQs (upper panels; vertical stripes); HPCDQs (lower panels; horizontal stripes) (Sect. 5; Table 1). |
| Open with DEXTER | |
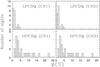 |
Fig. 7
Distribution of INOV amplitude (ψ), for LPCDQs (upper panel; vertical stripes) and HPCDQs (lower panel; horizontal stripes), estimated from the DLCs drawn using the two comparison stars, CS1 and CS2. |
| Open with DEXTER | |
© ESO, 2012
Current usage metrics show cumulative count of Article Views (full-text article views including HTML views, PDF and ePub downloads, according to the available data) and Abstracts Views on Vision4Press platform.
Data correspond to usage on the plateform after 2015. The current usage metrics is available 48-96 hours after online publication and is updated daily on week days.
Initial download of the metrics may take a while.