Fig. 1
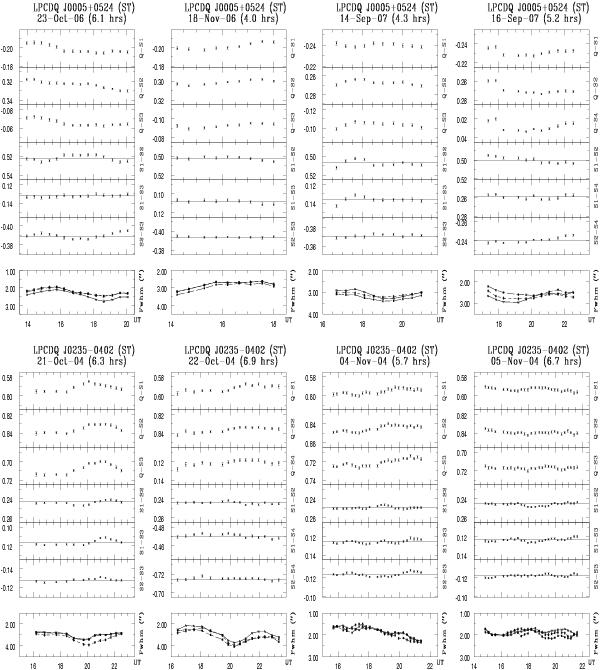
The intranight optical DLCs of the LPCDQs monitored in the present study. For each night, the source name, the telescope used, the date, and the duration of monitoring are given at the top. The upper 3 panels show the DLCs of the LPCDQ relative to 3 comparison stars while the attached lower 3 panels show the star-star DLCs, where the solid horizontal lines mark the mean for each star-star DLC. The bottom panel gives the plots of seeing variation for the night, based on 3 stars monitored along with the blazar on the same CCD frame.
Current usage metrics show cumulative count of Article Views (full-text article views including HTML views, PDF and ePub downloads, according to the available data) and Abstracts Views on Vision4Press platform.
Data correspond to usage on the plateform after 2015. The current usage metrics is available 48-96 hours after online publication and is updated daily on week days.
Initial download of the metrics may take a while.