| Issue |
A&A
Volume 544, August 2012
|
|
|---|---|---|
| Article Number | A53 | |
| Number of page(s) | 16 | |
| Section | Stellar structure and evolution | |
| DOI | https://doi.org/10.1051/0004-6361/201016235 | |
| Published online | 27 July 2012 | |
Online material
Appendix A: The models of eclipses with a solid or a gapped disk
Using our numerical code, we fitted models of the last two eclipses separately, using a solid disk as the eclipsing object. We made the same assumptions about the nature of the Be star, and we used the same fixed and free parameters as in Sect. 4.1. The disk was treated as having negligible thickness (infinitesimally small with all the mass concentrated in the plane) and an r-2 density profile. For simplicity, the precession axis was assumed to be perpendicular to the orbital plane. The resulting solution is shown in Table A.1 together with the error estimates. In Fig. A.1, we present models of two eclipses using a solid disk, for the 2003 eclipse on the left and for the 2008/9 eclipse on the right. The models containing a solid disk provide quite a good fit to the light curve and the global colour changes, reproducing both the depth and the shape of the eclipses, especially for the 2003 eclipse. This model, however, cannot explain the two maxima in the colour evolution during the eclipses.
Parameters of the solutions obtained for the solid disk model, derived independently for the 2003 eclipse (left) and the 2008/9 eclipse (right).
In the present study, we adopted a model containing a disk that has a concentric gap for the two last eclipses, taking into account the precession of the disk. We assumed the same disk diameter, disk density distribution, and orthogonality of the precession axis to the orbital plane, and the same Be star parameters
as in the case of the solid disk. This model was based solely on the B − IC, V − IC, and V − RC colour indices. We chose the same free parameters as in the case of the solid disk model for the 2008/9 eclipse (the tangential velocity was fixed at Vt = 1.57 R⊙ day-1) but added three more free parameters: the precession period Pprec and two parameters specifying the outer Rd1 and inner Rd2 radii of the gap. The resulting model is presented in Fig. A.2 and Table A.2. The best results were obtained for the precession period Pprec ≈ 31.91yr (about 5–6 Porb), for which the angle related to the disk precession phase φd changes from 50.00°at epoch E = 9 to 113.32°at epoch E = 10. An alternative solution was found to exist in which the precession phase φd = 66.68°at epoch E = 10 has a precession period Pprec ≈ 121.13 yr, which is almost four times longer (being about 22 Porb). In the light of the results of Sects. 4.3 and 4.4, both these periods of precession seem to be unrealistic. Comparison of this model with the Gałan et al. (2008) model for the 2003 eclipse alone reveals a problem. The gapped disk model seemed to be very promising for explaining the colour changes that occurred during the 2003 eclipse, but fails in the case of the 2008/9 eclipse, since it cannot explain either the colour changes during an eclipse or the strong “bump” in the light curve.
Parameters of the solution of the gapped disk model when applied to the last two eclipses together, taking into account disk precession.
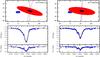 |
Fig. A.1
Modelling of the eclipse of a rapidy rotating Be star as a solid disk during the 2003 eclipse (left) and the 2008/9 eclipse (right). The top panels show the system projected onto the plane of the sky. The polar (hot) and equatorial (cool) areas of the star are shown by different shades. The inner (opaque) and outer (semi-transparent) areas of the disk are shown by dark and light shades, respectively. The sizes are expressed in solar radii. The lower panels show the B light curve (middle) and the B − IC colour index (bottom) together with the synthetic fits (lines). The Julian day in the upper right corner represents a moment at which (according to the model) the spatial configuration of the system is the same as that shown in the relevant panel. |
| Open with DEXTER | |
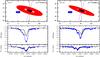 |
Fig. A.2
Modelling of the last two eclipses together with the precession period taken as an additional free parameter, when a gapped disk is considered. The sky plane projections of the system during the last two eclipses (at E = 9 and E = 10) (top), the B light curve (middle), and the B − IC colour index (bottom), together with the synthetic fits (lines) are shown. The symbols and the shades of colour have the same meaning as those in Fig. A.1. |
| Open with DEXTER | |
© ESO, 2012
Current usage metrics show cumulative count of Article Views (full-text article views including HTML views, PDF and ePub downloads, according to the available data) and Abstracts Views on Vision4Press platform.
Data correspond to usage on the plateform after 2015. The current usage metrics is available 48-96 hours after online publication and is updated daily on week days.
Initial download of the metrics may take a while.