Fig. A.2
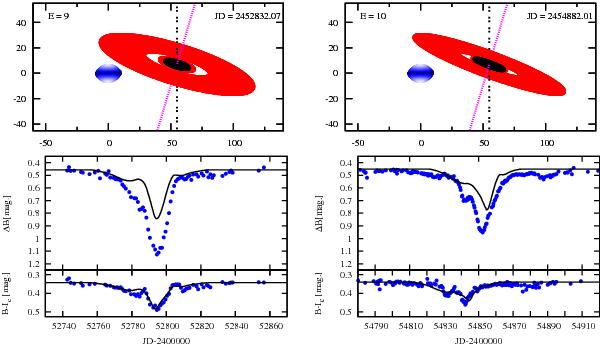
Modelling of the last two eclipses together with the precession period taken as an additional free parameter, when a gapped disk is considered. The sky plane projections of the system during the last two eclipses (at E = 9 and E = 10) (top), the B light curve (middle), and the B − IC colour index (bottom), together with the synthetic fits (lines) are shown. The symbols and the shades of colour have the same meaning as those in Fig. A.1.
Current usage metrics show cumulative count of Article Views (full-text article views including HTML views, PDF and ePub downloads, according to the available data) and Abstracts Views on Vision4Press platform.
Data correspond to usage on the plateform after 2015. The current usage metrics is available 48-96 hours after online publication and is updated daily on week days.
Initial download of the metrics may take a while.