Fig. A.1
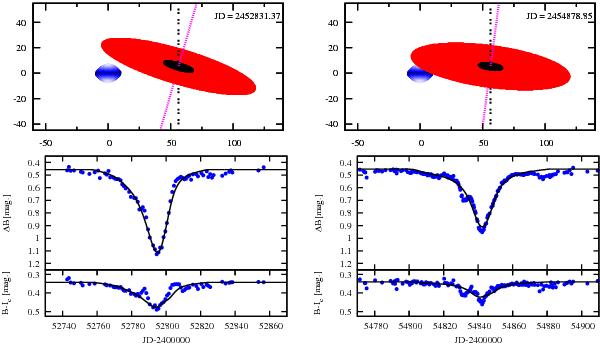
Modelling of the eclipse of a rapidy rotating Be star as a solid disk during the 2003 eclipse (left) and the 2008/9 eclipse (right). The top panels show the system projected onto the plane of the sky. The polar (hot) and equatorial (cool) areas of the star are shown by different shades. The inner (opaque) and outer (semi-transparent) areas of the disk are shown by dark and light shades, respectively. The sizes are expressed in solar radii. The lower panels show the B light curve (middle) and the B − IC colour index (bottom) together with the synthetic fits (lines). The Julian day in the upper right corner represents a moment at which (according to the model) the spatial configuration of the system is the same as that shown in the relevant panel.
Current usage metrics show cumulative count of Article Views (full-text article views including HTML views, PDF and ePub downloads, according to the available data) and Abstracts Views on Vision4Press platform.
Data correspond to usage on the plateform after 2015. The current usage metrics is available 48-96 hours after online publication and is updated daily on week days.
Initial download of the metrics may take a while.