| Issue |
A&A
Volume 543, July 2012
|
|
|---|---|---|
| Article Number | A54 | |
| Number of page(s) | 55 | |
| Section | Stellar structure and evolution | |
| DOI | https://doi.org/10.1051/0004-6361/201218948 | |
| Published online | 27 June 2012 | |
Online material
Appendix A: Expressions for λ and ν
The expressions that we use to derive λ and ν are related to the power spectrum, which is binned over n bins. The approximation of the probability density function of the mode profile in a binned power spectrum is therefore related to the mean power in a mode and its rms deviation. This approximation is given in more detail in Appourchaux (2004). The mean power in a mode of the binned power spectrum  is given by
 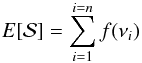 (A.1)
(A.1)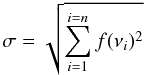 (A.2)where f is the mode profile given at frequency ν by
 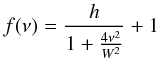 (A.3)
(A.3)
and ν is the frequency measured with respect to the central mode frequency, which is omitted, h is the mode height in units of the background noise (hence the additional 1), and W is the mode linewidth. The summation is done over frequency νi given by 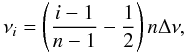 (A.4)where Δν is the frequency resolution of the original power spectrum and νi varies between − nΔν/2 and + nΔν/2, spanning nΔν, which is the resolution of the binned power spectrum. Finally the expressions for λ and ν are given by
  (A.5)
(A.5) (A.6)which are both implicitly functions of h and W.
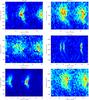 |
Fig. A.1
Echelle diagrams of the power spectra of KIC 1435467, KIC 2837475, KIC 3424541, KIC 3427720, KIC 3632418 and KIC 3733735. The power spectra are normalised by the background and then smoothed over 3 μHz. |
| Open with DEXTER | |
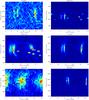 |
Fig. A.2
Echelle diagrams of the power spectra of KIC 3735871, KIC 5607242, KIC 5955122, KIC 6116048, KIC 6508366 and KIC 6603624. The power spectra are normalised by the background and then smoothed over 3 μHz. |
| Open with DEXTER | |
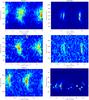 |
Fig. A.3
Echelle diagrams of the power spectra of KIC 6679371, KIC 6933899, KIC 7103006, KIC 7106245, KIC 7206837 and KIC 7341231. The power spectra are normalised by the background and then smoothed over 3 μHz. |
| Open with DEXTER | |
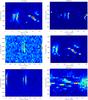 |
Fig. A.4
Echelle diagrams of the power spectra of KIC 7747078, KIC 7799349, KIC 7871531, KIC 7976303, KIC 8006161 and KIC 8026226. The power spectra are normalised by the background and then smoothed over 3 μHz. |
| Open with DEXTER | |
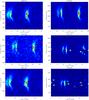 |
Fig. A.5
Echelle diagrams of the power spectra of KIC 8228742, KIC 8379927, KIC 8394589, KIC 8524425, KIC 8694723 and KIC 8702606. The power spectra are normalised by the background and then smoothed over 3 μHz. |
| Open with DEXTER | |
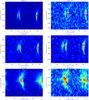 |
Fig. A.6
Echelle diagrams of the power spectra of KIC 8760414, KIC 9025370, KIC 9098294, KIC 9139151, KIC 9139163 and KIC 9206432. The power spectra are normalised by the background and then smoothed over 3 μHz. |
| Open with DEXTER | |
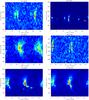 |
Fig. A.7
Echelle diagrams of the power spectra of KIC 9410862, KIC 9574283, KIC 9812850, KIC 9955598, KIC 10018963 and KIC 10162436. The power spectra are normalised by the background and then smoothed over 3 μHz. |
| Open with DEXTER | |
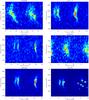 |
Fig. A.8
Echelle diagrams of the power spectra of KIC 10355856, KIC 10454113, KIC 10644253, KIC 10909629, KIC 10963065 and KIC 11026764. The power spectra are normalised by the background and then smoothed over 3 μHz. |
| Open with DEXTER | |
 |
Fig. A.9
Echelle diagrams of the power spectra of KIC 11081729, KIC 11193681, KIC 11244118, KIC 11253226, KIC 11395018 and KIC 11414712. The power spectra are normalised by the background and then smoothed over 3 μHz. |
| Open with DEXTER | |
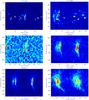 |
Fig. A.10
Echelle diagrams of the power spectra of KIC 11717120, KIC 11771760, KIC 11772920, KIC 12009504, KIC 12258514 and KIC 12317678. The power spectra are normalised by the background and then smoothed over 3 μHz. |
| Open with DEXTER | |
Frequencies for KIC 1435467.
Frequencies for KIC 2837475.
Frequencies for KIC 3424541.
Frequencies for KIC 3427720.
Frequencies for KIC 3632418.
Frequencies for KIC 3733735.
Frequencies for KIC 3735871.
Frequencies for KIC 5607242.
Frequencies for KIC 5955122.
Frequencies for KIC 6116048.
Frequencies for KIC 6508366.
Frequencies for KIC 6603624.
Frequencies for KIC 6679371.
continued.
Frequencies for KIC 6933899.
Frequencies for KIC 7103006.
Frequencies for KIC 7206837.
Frequencies for KIC 7341231.
Frequencies for KIC 7747078.
Frequencies for KIC 7799349.
Frequencies for KIC 7871531.
Frequencies for KIC 8006161.
Frequencies for KIC 8026226.
Frequencies for KIC 8228742.
Frequencies for KIC 8379927.
Frequencies for KIC 8394589.
Frequencies for KIC 8524425.
Frequencies for KIC 8694723.
Frequencies for KIC 8702606.
Frequencies for KIC 8760414.
Frequencies for KIC 9025370.
Frequencies for KIC 9098294.
Frequencies for KIC 9206432.
continued.
Frequencies for KIC 9410862.
Frequencies for KIC 9574283.
Frequencies for KIC 9812850.
Frequencies for KIC 9955598.
Frequencies for KIC 10018963.
Frequencies for KIC 10355856.
Frequencies for KIC 10454113.
Frequencies for KIC 10644253.
Frequencies for KIC 10909629.
Frequencies for KIC 10963065.
Frequencies for KIC 11026764.
Frequencies for KIC 11081729.
Frequencies for KIC 11193681.
Frequencies for KIC 11244118.
Frequencies for KIC 11253226.
Frequencies for KIC 11395018.
Frequencies for KIC 11414712.
Frequencies for KIC 11717120.
Frequencies for KIC 11771760.
Frequencies for KIC 11772920.
Frequencies for KIC 12009504.
Frequencies for KIC 12258514.
Frequencies for KIC 12317678.
Frequencies for KIC 12508433.
© ESO, 2012
Current usage metrics show cumulative count of Article Views (full-text article views including HTML views, PDF and ePub downloads, according to the available data) and Abstracts Views on Vision4Press platform.
Data correspond to usage on the plateform after 2015. The current usage metrics is available 48-96 hours after online publication and is updated daily on week days.
Initial download of the metrics may take a while.