| Issue |
A&A
Volume 537, January 2012
|
|
|---|---|---|
| Article Number | A16 | |
| Number of page(s) | 22 | |
| Section | Extragalactic astronomy | |
| DOI | https://doi.org/10.1051/0004-6361/201117581 | |
| Published online | 20 December 2011 | |
Online material
Appendix A: ePhot: energy and space adaptive filter for source detection
The standard techniques for source detections identify statistically significant brightness enhancements, derived from both unresolved (point) and resolved (extended) X-ray sources, in images accumulated in given energy ranges and observation times using tools such as “celldetect”, “vptdetect” and “wavdetect” in CIAO, “emldetect” in SAS. However, binning and projection always result in a loss of information. In contrast, present X-ray data, and in particular Chandra/ACIS data, are incredibly rich, containing spatial, energy and timing information at very high resolution. Even though X-ray data are organized in event files, preserving the information from the datacube, the scientific analysis is usually not performed directly on the original event files. The datacube is usually projected onto a spatial plane before performing source detection, and spectra are accumulated at given times or given source positions before performing spectral fits. To take full advantage of large datacubes, we should be able to detect sources in multidimensional space. We have therefore chosen to develop multidimensional source detection techniques using spatial, spectral, and timing information. We searched for clustering of X-ray events in a multidimensional space (energy and time in addition to the usual spatial coordinates), which allows us to efficiently detect X-ray bursty sources and X-ray sources characterized by a peaked spectrum (strong lines, spectra containing cut-offs), by reducing the elapsed time and/or the energy range (and therefore the background) where the source detection is performed.
We started by accumulating spectra at each galaxy position using different circular source extraction regions from three to nine pixels on cleaned event files.
As first step, we selecteded all galaxies with more that 12 background subtracted counts in the wide 0.3–4 keV band, to exclude the faintest objects, and achieve a high reliability (see Sect. A.2 below). At this stage, the background is evaluated from a map obtained from the original image after the exclusion of all bright sources (sources detected by a wavelet algorithm at a conservative threshold).
For all these galaxies, we searched for the source extraction region radius and contiguous energy band that minimize the Poisson probability for background fluctuation and maximize the signal-to-noise ratio. We adopted a logarithmically spaced energy grid with width 0.025 dex from 0.3 to 6.5 keV.
The background signal at the position of each source is evaluated by normalizing an average background at the source off-axis to the source spectrum accumulated between 7 and 11 keV, where the contribution of faint sources is negligible, owing to the sharp decrease in the mirror effective area. We did not use a “local” background for two main reasons: we wish to 1) minimize the systematic error caused by sharp background variations; and 2) search for source detections in relatively narrow energy bands, where the “local” background counts may be small and the associated statistical uncertainty comparatively high.
A.1. Background evaluation
The study of faint X-ray sources requires the most careful possible characterization of the background. The typical level of the CDFS background in the 0.5–7 keV band is 2–3 counts/arcsec2 or ~ 25–40 counts in an area of 2 arcsec radius. The spectrum of the Chandra background is complex, with several broad and narrow components of both internal and cosmic origin. To characterize the Chandra background, we extracted its spectrum from the following regions: 1) a circular region of radius 8 arcmin; 2) a circular region of radius 3 arcmin; 3) an annulus of internal radius 3 arcmin and external radius 6 arcmin; and 4) an annulus of internal radius 6 arcmin and external radius 8 arcmin. In all cases we excluded from the analysis circular regions of 5 arcsec radius around all X-ray detected sources. Figure A.1 shows the spectrum extracted from the broad 8 arcmin radius region. The continuum above a few keV is dominated by a particle-induced background (PIB), which has a power-law shape with a positive spectral index above 4–5 keV. We can clearly see at least eight strong emission lines superimposed to this continuum. The best-fit energies of the lines and their identification are given in Table A.1. The rising background continuum and the strong emission lines present above ~7 keV, coupled with the strongly decreasing mirror effective area above this energy, indicate that we should limit the analysis of faint sources to the band below 7 keV.
Chandra background lines.
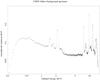 |
Fig. A.1
The spectrum of the background in the Chandra 4 Ms exposure of the CDFS. The spectrum has been extracted from a circle of 8 arcmin radius, after excluding 5 arcsec radius regions around all detected sources (10–20 arcsec for bright sources and extended sources). |
| Open with DEXTER | |
The low energy background spectrum peaks at ~0.5 keV and is quite dramatically lower between ~0.6 and ~1 keV. This continuum and the 0.585 line suggest that this part of the background spectrum is dominated by the thermal emission from the local “superbubble”. Below 0.3 keV, the response of the instrument decreases sharply and we therefore limited the analysis to energies above 0.3 keV.
We then fitted the background spectrum between 0.3 and 7 keV with a model including: 1) three Gaussian lines to account for the features at 1.48, 1.74, and 2.16 keV; 2) one broad Gaussian line to reproduce the broad bump between 1 and 3 keV; 3) two power laws modified at low energy by photoelectric absorption to reproduce the broad band hard continuum, all which were not convolved with the mirror effective area; and 4) a thermal component with abundances fixed to Solar values, that was convolved with the mirror effective area. This model provides a good fit to the background spectrum, without any systematic residuals. We then fitted the same model to the background spectra accumulated in three different regions, adjusting only the global normalizations of the model spectra accounting for the internal and cosmic background components. The fits are remarkably good above 1 keV. Below this energy, we see a deficit of counts in both the 3 arcmin radius spectrum and the 3–6 arcmin radius annulus spectrum, while there is an excess in the 6–8 arcmin annulus spectrum. The spectra become increasingly soft at large off-axis angles. The relative intensity of the thermal component is higher in the on-axis spectrum than the off-axis spectrum, as expected if this component is truly cosmic, because of the larger mirror vignetting at high off-axis angles. The increase of the strength of the low energy cut-off at smaller off-axis is then probably due to a thicker deposition of contaminants at the center of the ACIS-I 4 chip region.
The behavior observed for the emission lines is quite interesting. While the intensity of the 1.49 keV and 2.16 keV lines is constant with the off-axis angle, the intensity of the 1.78 keV Si line is larger at large off-axis angles.
The variations in the background spectra accumulated in thinner annuli becomes comparable to the statistical uncertainty. Guided by this analysis, we decided to adopt the average background spectra accumulated in the three r < 3′, 3′ < r < 6′, and 6′ < r < 8′ in the following analysis.
To evaluate the background counts in each source extraction region, we need to normalize the average background at three off-axis angles to that at each source position. We first extracted spectra from circular regions of 10 arcsec radii centered at each galaxy position, and then normalize the average background to that in these spectra using the 7–11 keV faint-source-free band. The statistical uncertainty in the background evaluation is therefore mostly given by the 7–11 keV total number of counts at the source position. The choice of the size of the extraction region at each galaxy position must then satisfy two competing requirements. On the one hand, the region must be large enough to provide enough counts to keep statistical fluctuation small. On the other hand, a small region has the advantage of avoiding systematic errors caused by sharp variations in the exposure time (and so of the background) typical of mosaics such as ACIS-I CDFS, cosmetic defects, and crowded regions with several sources within a few arcsec. The average CDFS 7–11 keV background in a 10 arcsec radius region is between 600 and 700 counts, ~ 3 times higher than the 0.5–2 keV average background, 4 times the 1–2 keV background, and 2 times the 1–4 keV background. Therefore, a circular region of 10 arcsec radius is a good compromise, because it collects a number of 7–11 keV counts similar to or higher than the 0.5–2, 1–2 or 1–4 keV counts in 10–20 arcsec annulus (a typical region used to extract a “local” background in crowded areas such as the CDFS), in a three times smaller area.
A.2. Completeness, reliability and sky coverage
To extract statistically quantitative information from a given sample of “detected” sources, we need to first assess its completeness and reliability (number of spurious detections). We performed a series of extensive detection runs on simulated data.
To assess the reliability of our survey, we first performed simulations using background spectra only. We simulated about 105 spectra at the positions of the sources detected in the CDFS to use exactly the same exposure time, vignetting, and PSF, but including only the average background at each off-axis position. We applied our version of ePhot to these simulations and studied the number of spurious detections as a function of various parameters: 1) the threshold on background-subtracted counts in a wide (0.3–4 keV) band; 2) the minimum and maximum source-extraction regions; 3) the energy grid used to search for detections; 4) the band-width Emax/Emin; and 5) the Poisson probability threshold for a source detection. We chose a combination of parameters that keeps the number of spurious detections smaller than one every 5000 spectra, i.e. the number of candidates in our search (see Sect. 2): these are 0.3–4 keV background-subtracted counts ≥ 12, Emax/Emin > 2, and Poisson probability < 2 × 10⁴.
To study the completeness of our survey, we performed detection runs on simulated source plus background spectra. We used mock X-ray catalogs generated by Gilli, which include about 105 AGN with a distribution of luminosities, redshifts, and absorbing column densities in accordance with the Gilli et al. CXB model. In particular, the mock catalogs include sources with unabsorbed flux down to 10-18 cgs, where the AGN density is ~20 000 deg2. Source spectra are distributed over six templates, with column densities NH up to 3 × 1024 cm-2. A pure reflection spectrum is also considered to account for heavily Compton thick sources. The distributions of spectra is a strong function of both luminosity and redshift (see Gilli et al. , for details). Using these mock catalogs, we simulated a 10 deg2Chandra survey with the same characteristics of the CDFS survey. We simulated sources at the position of the sources detected in the CDFS. We added to each simulated spectrum a background proportional to the average background at each off-axis angle. Finally, we run on each source + background simulated spectrum our source detection algorithm ePhot. These simulations are used to study the completeness of our survey and compute the corresponding sky coverage. In Fig. A.2, top panel, we compare the 0.5–2 keV observed flux histogram of the simulated sources with that of the sources detected by ePhot with the thresholds defined above. The ratio of the two histograms gives the completeness of our survey, or the sky coverage, when normalized to the CDFS searched area. Figure A.2, bottom panel, compares the ePhotsky coverage for the ERS area of the CDFS to that of a traditional detection algorithm at the same probability threshold (same fraction of spurious detections).
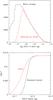 |
Fig. A.2
Top panel: the 0.5–2 keV flux histogram of the simulated sources (black solid histogram) and of the simulated sources detected by e-phot. Bottom panel: the Chandra sky coverage in the ERS area obtained using a standard detection algorithm (black solid curve) and using e-phot (red dashed curve) at the same probability threshold. |
| Open with DEXTER | |
A.3. Photometry
Our algorithm e-phot was also run on the galaxy samples with fixed energy bands (0.5–2 keV, thus optimizing only for the size of the source extraction region). The X-ray fluxes in the band 0.5–2 keV are estimated from e-phot count rates in the 0.5–2 keV band if the signal-to-noise ratio in this band is higher than 2.5 or from the count rates in the band that optimize the detection otherwise. A simple power-law spectrum with αE = 0.4 was assumed for the count rate flux conversion. To test our photometry, we compared the 0.5–2 keV flux obtained from the event files of the first 2 Ms observations to those in Luo08, and the 0.5–2 keV flux obtained form the full 4 Ms observations to those in Xue11. The agreement is remarkable, the median of the two samples agree to within 3% and the semi-interquartile range of their ratio is 0.06. Fluxes of faint detections can be statistically over-estimated because of the so-called Eddington bias (Hogg & Turner ; Wang ). We estimated the bias according to Wang and found that it is at most ~20% for our faintest detection and negligible for most of the Chandra-GOODS-ERS and Chandra-GOODS-MUSIC sources. Luminosities in Table 3 are calculated from fluxes that are corrected for the Eddington bias.
© ESO, 2012
Current usage metrics show cumulative count of Article Views (full-text article views including HTML views, PDF and ePub downloads, according to the available data) and Abstracts Views on Vision4Press platform.
Data correspond to usage on the plateform after 2015. The current usage metrics is available 48-96 hours after online publication and is updated daily on week days.
Initial download of the metrics may take a while.