Fig. A.2
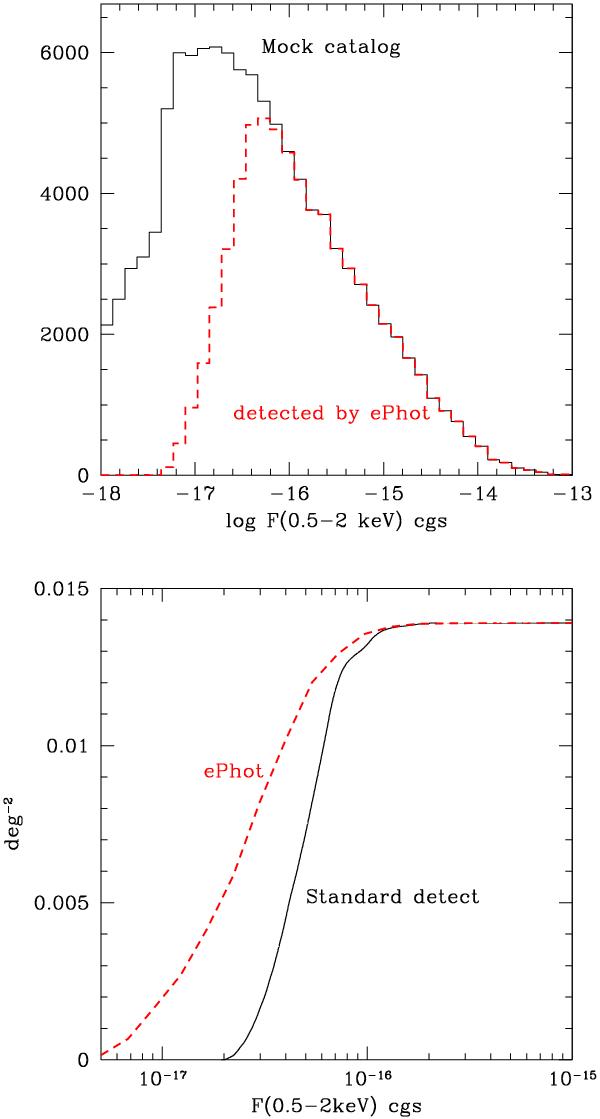
Top panel: the 0.5–2 keV flux histogram of the simulated sources (black solid histogram) and of the simulated sources detected by e-phot. Bottom panel: the Chandra sky coverage in the ERS area obtained using a standard detection algorithm (black solid curve) and using e-phot (red dashed curve) at the same probability threshold.
Current usage metrics show cumulative count of Article Views (full-text article views including HTML views, PDF and ePub downloads, according to the available data) and Abstracts Views on Vision4Press platform.
Data correspond to usage on the plateform after 2015. The current usage metrics is available 48-96 hours after online publication and is updated daily on week days.
Initial download of the metrics may take a while.