| Issue |
A&A
Volume 535, November 2011
|
|
|---|---|---|
| Article Number | A103 | |
| Number of page(s) | 32 | |
| Section | Extragalactic astronomy | |
| DOI | https://doi.org/10.1051/0004-6361/201117096 | |
| Published online | 18 November 2011 | |
Online material
Appendix A: Spectral survey and line catalog
The full spectrum, from 30 to 50 GHz, is available as an ASCII file at the Strasbourg Astronomical Data Center (CDS).
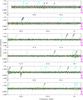 |
Fig. A.1
Spectrum of the ATCA 7 mm survey toward PKS 1830 − 211. The grey envelope indicates the 3σ noise level. The LTE synthetic model, assuming Trot = 5.14 K for all molecules, is overlaid in red. The spectrum in magenta, offset at a level of 0.995, gives the relative differences between observations taken in September 2009 and March 2010, normalized to the average spectrum. The corresponding scale is given on the right of each box (±5%). Some non-detections are indicated in light blue. |
| Open with DEXTER | |
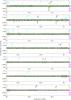 |
Fig. A.1
Continued. |
| Open with DEXTER | |
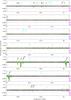 |
Fig. A.1
Continued. |
| Open with DEXTER | |
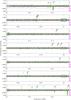 |
Fig. A.1
Continued. |
| Open with DEXTER | |
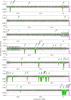 |
Fig. A.1
Continued. |
| Open with DEXTER | |
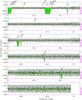 |
Fig. A.1
Continued. |
| Open with DEXTER | |
Appendix B: Notes on individual molecules
In this section, we give short reviews of the different species and discuss constraints or new results obtained from this survey.
B.1. C2H
The highly reactive ethynyl radical was first discovered and identified toward the Orion nebula by Tucker et al. (1974) based on its hyperfine structure, while it had still not been observed in the laboratory. C2H has turned out to be both an ubiquitous and abundant species in the interstellar medium, including in diffuse clouds (Lucas & Liszt 2000b) where its abundance is of the order of a few 10-8 with respect to H2.
The ground state transition N = 1–0 at ν0 = 87 GHz is decomposed into six components by hyperfine splitting. Toward PKS 1830−211, the strongest hyperfine components were previously observed by Menten et al. (1999) with the VLA, although at low spectral resolution. We detect here all six N = 1–0 hyperfine components arising from the SW absorption, as well as the two strongest hyperfine components (the J = 3/2–1/2, F = 2–1 and F = 1–0) related to the NE absorption at −147 km s-1 (see Fig. B.1). The absorption depths reflect the LTE relative intensities of the hyperfine components, indicating that the lines are optically thin.
B.2. HCN, HNC and HCO+
Molecular absorption was first reported toward PKS 1830 − 211 by Wiklind & Combes (1996b) after the detection of the HCN, HNC, and HCO+ 2–1 transitions, allowing the redshift of the intervening galaxy to be derived. Figure B.2 shows the full spectra of the HCO+, HCN, and HNC 1–0 transitions observed in our survey. The first two lines are likely saturated and their opacities could be underestimated. In particular two findings seem to indicate that the HCO+ column density might be underestimated by a factor of 2–3. First, the HCO+/H13CO+ ratio toward FG0.89SW is a factor of ~2 lower than the corresponding HCN/H13CN and HNC/HN13C ratios. Second, the ratio of the column densities along the two lines of sight, SW/NE is also a factor 2–3 lower for HCO+ than for other species (see Table 4). In any case, the uncertainty in the opacity introduced by the uncertainty in the continuum background illumination is nevertheless large for both HCO+ and HCN (see Sect. 3.3)
Time variations and the discovery of additional velocity components are discussed in Sect. 3.2 and Sect. 3.5, respectively.
Parameters and fitting results for lines detected toward FG0.89SW.
B.3. N2H+
N2H+ is thought to be one of the most abundant interstellar ions, and plays a key role in nitrogen chemistry. It is detected in a large number of Galactic clouds. However, it remains elusive in diffuse clouds (Liszt & Lucas 2001), with an abundance upper limit more than two orders of magnitude lower than its abundance in FG0.89SW. We note that N2H+ is also rare in translucent clouds, e.g., Turner (1995a) having detected it in only 2 out of 16 such clouds.
B.4. HOC+
The hydroxymethylidynium ion, HOC+, isomer of the formyl ion, was first tentatively identified in Sgr B2 by Woods et al. (1983). Its presence in several dense molecular clouds was then confirmed by Ziurys & Apponi (1995) and Apponi & Ziurys (1997), with a relative abundance HCO+/HOC+ ~ 360–6000. This abundance ratio is however about one order of magnitude lower (~70–120) in diffuse clouds (Liszt et al. 2004), and seemingly has an in-between value in PDR: Apponi et al. (1999) derived HCO+/HOC + ~ 270 toward the Orion bar. Martín et al. (2009) find a ratio ~70 toward NGC 253, similar to that in diffuse clouds.
In FG0.89SW, we derive a ratio HCO+/HOC+ of ~60, although this value might be slightly underestimated because of the large opacity of HCO+. The H13CO+/HOC+ ratio is indeed 2.6 ± 0.1. Assuming a 12C/13C ratio of 35, the HCO+/HOC+ ratio in FG0.89SW is comparable to that in diffuse clouds.
B.5. HCO
The formyl radical, HCO, was discovered in the interstellar medium by Snyder et al. (1976) and has been identified as a tracer of the cloud-illuminated interface in PDRs (de Jong et al. 1980; Schilke et al. 2001). García-Burillo et al. (2002) revealed widespread HCO emission in the nuclear starburst of M 82, with HCO, CO, and HII emission in nested rings, HCO extending farther out in the disk. Gérin et al. (2009) demonstrated that the HCO emission in the Horsehead nebula traces the PDR front, coincident with PAH and hydrocarbon emission. The abundance of HCO in the PDR is comparable to that of HCO+, whereas it becomes about one order of magnitude less in the dense regions shielded from UV radiation. To the best of our knowledge, HCO has not been detected in diffuse or translucent clouds to date, although it is located close in frequency to the H13CO+ (1–0) and SiO (2–1) lines.
We clearly detect three (out of the four) hyperfine components of the ground state transition 101−000, the remaining low intensity component being buried in the noise level. The relative optical depths are consistent with LTE intensities, suggesting that the lines are optically thin. We derive an abundance ratio HCO+/HCO of ~13, similar to the values observed in dense shielded regions. This value is even larger if we consider that the HCO+ opacity might be underestimated by a factor 2–3.
B.6. CH2NH
We identify the absorption feature near 33.93 GHz with the 101−000 ground state transition of methanimine, as it is the simplest interstellar molecule with lowest energy transition close to that frequency. The hyperfine structure is not resolved. Only one line of methanimine is located within the limits of our frequency coverage. The strongest transitions, with predicted τ > 0.1 based on the 101−000 absorption depth, have rest frequencies of 127.9, 166.9, 225.6 and 284.3 GHz. Of these, only the second and last fall in an ALMA band for a redshift of z = 0.89.
Methanimine was first detected in Sgr B2 by Godfrey et al. (1973) and has been further observed in several star-forming regions and translucent clouds (Turner et al. 1999), but is not detected in cold dark clouds (Turner 1991; Dickens et al. 1997). It has been tentatively detected in NGC 253 (Martín et al. 2006) and has been observed in Arp 220 (Salter et al. 2008). Methanimine is a prebiotic molecule, precursor to more complex molecules such as glycine.
B.7. CH3NH2
Methylamine is the saturated and terminal product of the hydrogenation series based on the cyanide radical: CN-HCN-CH2NH-CH3NH2.
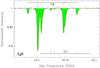 |
Fig. B.1
Spectrum of the C2H N = 1–0 line. The different hyperfine components are indicated with their relative intensities for the SW (top) and NE (bottom) absorptions. Note the clear detection of the two strongest hyperfine components arising from FG0.89NE. The red curve shows the LTE synthetic spectrum, taking column densities of 1.3 × 10¹⁵ and 4 × 1013 cm-2 toward the SW and NE images respectively, and a rotation temperature of 5.14 K. |
| Open with DEXTER | |
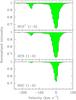 |
Fig. B.2
Full spectra of the HCO+, HCN, and HNC 1–0 transitions, showing the absorption toward the SW (0 km s-1) and NE ( − 147 km s-1) images of the quasar. A zoom in with a narrower intensity scale, shown in Fig. 6, reveals additional velocity components. |
| Open with DEXTER | |
Methylamine has a very complex spectrum resulting from the combination of internal rotation of the CH3 group, the asymmetry of the molecule and the inversion of the NH2 group (Takagi & Kojima 1973; Ilyushin & Lovas 2007). It was first detected in Sgr B2 by Kaifu et al. (1974) (see also Turner 1991). No extragalactic detection has been reported to date.
B.8. CH3OH
Interstellar methanol was first detected toward Sgr B2 and Sgr A by Ball et al. (1970) and is widely observed toward star forming regions, dark clouds, and also translucent clouds (Turner 1998). It has been detected in various extragalactic sources (e.g. Henkel et al. 1987). Methanol is about one order of magnitude less abundant in cold/translucent clouds than in star forming regions, where its abundance can reach a few 10-8 relative to H2. It is not detected in diffuse clouds, down to upper limits of a few lower than its abundance in cold clouds (Liszt et al. 2008). Methanol is the terminal product of hydrogenation of CO.
The methanol spectrum has a multitude of transitions, of which only one is strong enough to be detected within our frequency coverage. Therefore, no excitation analysis can be deduced. Assuming LTE equilibrium with the CMB radiation field, we derive a relatively high methanol abundance of a few 10-8 relative to H2 in FG0.89SW. Several strong lines (with predicted τ ~ 0.02–0.4) near rest frequency of 300 GHz and redshifted in the 2 mm band are (simultaneously) observable (e.g. with ALMA or PdBI) and could provide a stringent measurement of the methanol rotation temperature.
The calculations of Jansen et al. (2011) have shown that methanol could be a sensitive probe of spatial and temporal variations in the proton-to-electron mass ratio.
B.9. l-C3H
We identify the feature around 40.4 GHz with the J = 7/2–5/2 transition of the  rotational ladder of the propynylidyne radical (ν0 = 76.2 GHz). The transition is split into two Λ-doublets (see Fig. B.3), approximately equal in strength and spaced by about 5 MHz in the rest frame, which secures our identification. The hyperfine structure is unresolved. No other transitions of l-C3H are detected in our frequency coverage.
Linear propynylidyne was first identified by Thaddeus et al. (1985a) toward IRC+10216 and TMC 1. It is observed in translucent clouds (Turner et al. 2000) but remains undetected in diffuse clouds (Lucas & Liszt 2000b, although this might just be a sensitivity issue, as their upper limits of l-C3H/HCO+ is still higher than the value we derive). No extragalactic detections have been reported to date that we are aware of.
The cyclic isomer form c-C3H is detected in dense (Yamamoto et al. 1987; Fossé et al. 2001) and translucent (Turner et al. 2000) clouds, with c-C3H/l-C3H ratio ~ 5. No transitions of c-C3H are detected in our survey. In particular, the non-detection of the NKaKc = 212-111 transition at a rest-frame frequency of 91.5 GHz, which is connected to the ground state, yields an upper limit of ~3 × 1012 cm-2, and a c-C3H/l-C3H ratio < 0.4. We note that a low ratio c-C3H/l-C3H < 1 was found by Turner et al. (2000) toward one translucent cloud (CB228).
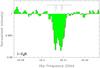 |
Fig. B.3
Spectrum of the l-C3H J = 7/2–5/2 transition. The locations of the two Λ-doublets with hyperfine structure are indicated. |
| Open with DEXTER | |
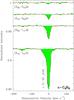 |
Fig. B.4
c-C3H2 transitions. The dashed curve on the wing of the 212 − 101 line corresponds to the LTE prediction for the HCS+J = 2–1 line with a HCS+ column density of 5 × 1012 cm-2. |
| Open with DEXTER | |
B.10. c-C3H2
The ring molecule cyclo-propenylidene c-C3H2 is a fairly ubiquituous interstellar species (e.g., Thaddeus et al. 1985b; Matthews & Irvine 1985; Cox et al. 1988; Madden et al. 1989).
We detect 2 ortho and 2 para lines, yielding an ortho/para ratio of 2.8 ± 0.1, comparable to the statistical weight 3:1.
A tight correlation exists between the abundances of C2H and c-C3H2 in diffuse clouds (Lucas & Liszt 2000b; Gérin et al. 2011), with N(C2H) = (28 ± 1.4)N(c-C3H2). We derive a comparable abundance ratio C2H/c-C3H2 = 23.6 ± 0.2.
The excess absorption in the blue wing of the c-C3H2 212–101 line (see Fig. B.4) could be due to the known velocity component at ~−20 km s-1 toward FG0.89SW (see e.g. Fig. 5 from Muller et al. 2006). Alternatively, we note that this feature could be due the HCS+ 2–1 line, which would fall at ~−32 km s-1 with respect to the center of the c-C3H2 212–101 line. HCS+ is indeed detected in diffuse clouds with an abundance of ~3 × 10⁻¹⁰ relative to H2 (Lucas & Liszt 2002). If its abundance were similar in FG0.89SW, then the LTE predicted absorption depth would be of the order of τ = 0.015, i.e. compatible with the observations. There are no other lines of HCS+ within our frequency coverage. Observations of the J = 1–0, 3–2, or 4–3 transitions (redshifted to 22.6, 67.9, and 90.5 GHz, and with predicted opacity of τ = 0.007, 0.013, and 0.006, respectively) could confirm the presence of HCS+.
B.11. l-C3H2
Propadienylidene, l-C3H2, is the linear isomer of c-C3H2 that was first discovered by Cernicharo et al. (1991) in the carbon-chain rich dark cloud TMC 1. Noticeably, Maier et al. (2011) identified l-C3H2 as the probable carrier of two conspicuous diffuse interstellar bands (at 4881 and 5450 Å).
The ortho/para ratio is  , in agreement with the statistical weight of 3:1.
The linear form is usually less abundant than the cyclic one, with a cyclic/linear ratio of 3–5 in diffuse clouds, 70 in TMC 1, and >150 in Sgr B2 (Cernicharo et al. 1991, 1999, see also Turner et al. 2000). We derive a cyclic/linear ratio of 25 ± 3, which is in-between the ratio observed toward diffuse clouds and TMC 1.
B.12. H2CCN
The non-linear cyanomethyl radical has a very complicated spectrum owing to the unpaired electron and hyperfine splitting induced by the H and N atoms. We detect two absorption features, corresponding to NKa,Kb = 303–202 and 404–303. Both are from the ortho species (ortho states are characterized by Ka even and para states by Ka odd).
Irvine et al. (1988) first identified H2CCN toward Sgr B2 and TMC 1. It was also detected in the circumstellar envelope of IRC+10216 (Agúndez et al. 2008), but, to the best of our knowledge, it has not been observed toward other sources. In particular, this is the first extragalactic detection of this molecule.
B.13. CH3CCH
Methyl acetylene was first detected in Sgr B2 and Orion A by Snyder & Buhl (1973). It is observed in dark clouds (e.g., Irvine et al. 1981) and has been detected in the nearby starburst galaxies NGC253, NGC4945 and M82 (e.g. Mauersberger et al. 1991; Wang et al. 2004).
We detect the JK = 50–40 transition, but not the JK = 40–30, suggesting that the rotation temperature is higher than 5.14 K. The kinetic temperature was fixed to 50 K (see B.14).
We note that CH3CCH is the molecule in our survey which shows the miminum scatter in relative abundances between the different sources.
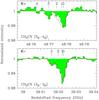 |
Fig. B.5
Spectra of the 4K − 3K and 5K − 4K transitions of CH3CN. Our LTE prediction assuming a kinetic temperature of 50 K is overlaid. |
| Open with DEXTER | |
B.14. CH3CN
Methyl cyanide was first detected in space toward the Galactic center by Solomon et al. (1971). It is commonly detected in hot cores (e.g. Olmi et al. 1993), where the heating from massive stars is thought to evaporate the products of grain surface chemistry. The abundance of CH3CN in these regions of active star formation exceeds 10-9 relative to H2 (e.g. Kalenskii et al. 2000). We note that CH3CN is also observed in dark clouds (Matthews & Sears 1983) and has been detected in NGC253 (Mauersberger et al. 1991). On the other hand, CH3CN is detected in neither diffuse (Liszt & Lucas 2001) nor translucent clouds (Turner 2000), with upper limits clearly lower than abundances in dark clouds.
Symmetric-top molecule are excellent temperature probes, because radiative transitions between the different K-ladders are forbidden, so that only collisional excitation is effective. Consequently, the rotation temperature of the molecule can be derived within the same K-ladder on the one hand, and the kinetic temperature is reflected in the population of the K levels on the other hand (e.g. Churchwell & Hollis 1983).
In our LTE synthetic spectrum approach, the term  in Eq. (2) was changed to
  , where EKK is the lowest energy level of each K-ladder, to evaluate the opacity of each transition (see e.g., Olmi et al. 1993). The partition function was calculated accordingly by taking into account both the rotation and kinetic temperatures
 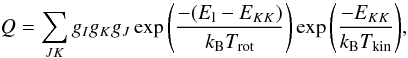 (B.1)where gJ = (2J+1) and the product gIgK = 2 for K = 0 and K ≠ 3n (n > 0), and gIgK = 4 for K = 3n.
Two groups of transitions of methyl cyanide fall in the frequency coverage of our survey, the JK = 4K–3K redshifted near 39 GHz, and the JK = 5K–4K, redshifted to ~ 48.8 GHz. Both are clearly detected. Remarkably, the K-ladder transitions are detected up to K = 3 (see Fig. B.5), with lower energy state up to 70 K above the ground level. We note that CH3CN is the only species in our survey showing absorption from such high energy levels. This suggests that the kinetic temperature is high, in agreement with the observations of inversion lines of ammonia up to (J,K) = 10,10 (which lies at about 1000 K above the ground state) by Henkel et al. (2008). On the basis of their estimates, the kinetic temperature Tkin is about 80 K for 80–90% of the ammonia gas, while the remaining fraction could even reach Tkin > 600 K.
A robust fitting of the CH3CN spectra is difficult as the different K-ladder transitions are close in frequency relative to the width of the lines. Nevertheless, a good match of the observations could be found using our LTE model by assuming a CH3CN column density of 1.3 × 1013 cm-2 and a kinetic temperature of 50 K (see Fig. B.5). This latter parameter value is comparable to, although slightly lower than that obtained by Henkel et al. (2008). We neglect the broadening of the line due to hyperfine splitting, as it is at most of 1.5 MHz for the principal hyperfine components of the JK = 54–44 transition.
B.15. H2CCO
Ketene was first detected in Sgr B2 by Turner (1977). It was detected in line surveys of regions of low-mass and massive star formation (e.g. Turner 1991; van Dishoeck et al. 1995; Ruiterkamp et al. 2007), as well as in both translucent and dark clouds (Turner et al. 1999; Kaifu et al. 2004), suggesting that it is a common interstellar species. However, only few specific studies of the molecule have been conducted, and its formation mechanism(s) is subject to controversy: H2CCO could be either produced by gas-phase reactions (Turner et al. 1999) or formed by means of surface chemistry, followed by grain desorption (Ruiterkamp et al. 2007). Its typical abundance is of the order of 10-10–10-9 relative to H2.
We detect four different (ortho) transitions of H2CCO in our survey, yielding a rotation temperature of  K, significantly lower than TCMB = 5.14 K at z = 0.89.
B.16. HNCO
Isocyanic acid was first discovered toward Sgr B2 (Snyder & Buhl 1972). We detect two lines of HNCO, the 303–202 and the 404–303, the latter in a low-noise region of the survey. They do not appear to be at LTE equilibrium, and we could not derive a positive rotation temperature. The centroid velocity of HNCO is also significantly offset with respect to the average velocity of all molecules. We could not identify lines from other molecules close in frequency, and therefore discard the possibility of a false identification.
B.17. SiO
Silicon monoxide is another commonly observed interstellar molecule, considered as a good shock tracer. Its abundance is low in cold dark clouds (of the order of or less than 10-12 relative to H2), where it is presumably heavily depleted onto dust grains, but can reach values several orders of magnitude higher in outflows and shocked gas. It is found to have an intermediate abundance (SiO/H2 ~ 10-10) in diffuse and translucent clouds (Lucas & Liszt 2000a; Turner 2000). Toward FG0.89SW, we find a SiO abundance of nearly 4 × 10⁻¹⁰ that is comparable to, though slightly higher than, that in diffuse/translucent clouds.
Interestingly, Ziurys et al. (1989) found a correlation between ln[SiO/HCN] and the inverse of the kinetic temperature in Galactic molecular clouds: were this correlation to hold for the gas in FG0.89SW, the SiO/HCN ratio would then point to a kinetic temperature of ~ 30 K, a value not so far from the kinetic temperature estimated from CH3CN.
The 29SiO isotopologue is also detected and we derive a 28Si/29Si ratio of  , which is roughly half the Solar System value.
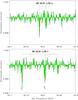 |
Fig. B.6
Spectrum of NS (2–1). The hyperfine structure with relative intensities is indicated. |
| Open with DEXTER | |
B.18. CH3CHO
Acetaldehyde is an asymmetric rotor, with two symmetry states (A and E) resulting from the rotation of the methyl group. Electric dipole transitions are not allowed between these states, which have the same weight statistic. Each transition is dedoubled by the symmetry, and the resulting spectrum consists of a series of closeby A/E doublets.
The detection of acetaldehyde was first reported toward Sgr B2 (Ball et al. 1971) and the molecule has been observed in cold dark clouds (Matthews et al. 1985) and translucent clouds (Turner et al. 1999). Interestingly, Chengalur & Kanekar (2003) observed that CH3CHO is more widespread toward the Galactic center than most other complex organic molecules. They argue that the molecule could be produced by shock-induced disruption on dust mantles.
No extragalactic detection has yet been reported for this species.
B.19. NS
Nitrogen sulfide was first detected in Sgr B2 by Gottlieb et al. (1975). It is detected in quiescent clouds (McGonagle et al. 1994) and in massive-star forming regions (McGonagle & Irvine 1997). There are no reports of NS detection in diffuse or translucent clouds to date.
The rotational levels of the molecule are divided into two levels (e/f) with opposite parity by Λ-doubling, each of them subdivided into hyperfine structure corresponding to the nitrogen nucleus. We clearly detect the hyperfine components with highest relative intensities (see Fig. B.6). We note that the frequency interval between ~36 and 40 GHz is the region observed with the lowest noise level in our survey, allowing these weak lines of NS, H2CS, C2S, and SO+ to be detected.
Taking the CS column density estimated by Muller et al. (2006), we find a ratio NS/CS ~ 0.02, comparable to the values 0.02–0.05 measured by Hatchell & Viti (2002) in a sample of hot cores. Martín et al. (2003) estimated a ratio NS/CS = 0.4 in NGC 253, which they interpreted as the signature of NS chemical enhancement by shocks (see also Viti et al. 2001).
B.20. H2CS
Thioformaldehyde was first detected in absorption toward Sgr B2 by Sinclair et al. (1973). It is observed in star forming regions and cold dark clouds (e.g. Irvine et al. 1989; Minh et al. 1991) as well as in translucent clouds (Turner 1996). Tentative extragalactic detections are reported by Heikkilä et al. (1999) in the LMC and Martín et al. (2006) in NGC253.
Two lines of H2CS are detected, one of each ortho and para form, from which we derive an ortho/para ratio of  . However, we note that another ortho line, the 212–111 at a rest frequency of 67.653820 GHz, should have been detected at the same intensity as the 211–110 line, according to the LTE prediction. It is fitted with an opacity twice lower, although with a significance of just 3σ on its integrated opacity, which is the reason we discarded it from our estimate of the ortho-H2CS column density.
The H2CO/H2CS ratio, derived from their para forms, is 32 ± 6, fully consistent with the present oxygen-to-sulphur cosmic abundance ratio (33:1, Lodders 2003).
B.21. SO
Sulfur monoxide was first detected by Gottlieb & Ball (1973) toward several star forming regions and later observed in dark clouds by Rydbeck et al. (1980).
From the JK = 21–10 line detected in our survey, we derive an abundance of ~10-9 relative to H2, similar to that observed in Galactic diffuse clouds (Lucas & Liszt 2002), and ~25 lower than that in translucent clouds (Turner 1995b).
The non-detection of the SO2 111–000 ground state transition yields a ratio SO/SO2 > 8. Both species are observed in quiescent translucent clouds with an abundance ratio SO/SO2 ~ 1–15 (Turner 1995b). It has been found that SO2 is not detected in diffuse clouds, down to a fractional abundance < 10-9 (Lucas & Liszt 2002).
The non-detection of 34SO points to an upper limit of SO/34SO > 13.7 (3σ). Muller et al. (2006) derived a ratio 32S/34S of 10.5 ± 0.6 from measurements of CS and H2S, and their isotopologues.
B.22. SO+
The reactive radical SO+ is characterized by a 2Π1/2 ground state. Its spin-doubled rotational transitions are split by Λ-type doubling.
The SO+J = 3/2–1/2 e line is partly blended with the F = 5/2–3/2 f hyperfine transition of NS. The width of the spectral feature at νsky ~ 36.807 GHz, as obtained by the fit of a single Gaussian component, is 37 ± 5 km s-1, i.e. much larger than the width of other lines. Nevertheless, after taking into account the SO + e/f doublet together with the NS line, the LTE synthetic spectrum reproduces fairly well the observations.
It has been found that SO+ is a rather widespread and quite abundant interstellar species (Turner 1994), and is seen, although weakly, in translucent clouds (Turner 1996). There, the abundance ratio SO/SO+ is of the order of 30. We estimate a ratio SO/SO + = 15 ± 3 of comparable order of magnitude toward FG0.89SW.
B.23. C4H
The butadiynyl radical was first reported by Guélin et al. (1978) toward IRC+10216 and has been observed toward dark clouds by Irvine et al. (1981). It is present in translucent clouds with a quite high abundance of a few 10-8 relative to H2 (Turner 2000). No extragalactic detection has been reported so far.
The interaction of the unpaired electron with the molecular rotation produces fine structure, which is divided further into (here unresolved) hyperfine structure by the proton spin. The resulting spectrum of C4H consists of a series of closeby doublets, of which we detect four (N = 6–5 to N = 9–8) within the limits of our frequency coverage.
B.24. HC3N
The highly unsaturated cyanoacetylene molecule was first detected in Sgr B2 (Turner 1971) and is observed in various sources, such as translucent clouds, dense dark clouds, and star forming regions, with abundances of ~ 10-10–10-9 relative to H2. HC3N emission has also been detected in several extragalactic objects (see Lindberg et al. 2011 for a recent review).
We detect all four transitions of HC3N within the frequency range of our survey, from J = 7–6 to J = 10–9. The J = 3–2 and J = 5–4 lines of HC3N were previously detected with the VLA by Menten et al. (1999). More recently, Henkel et al. (2009) reported the detection of all transitions from J = 3–2 to J = 7–6 with the Effelsberg 100 m telescope. The J = 10–9 line was not detected. The results of their observations are reported in the rotation diagram together with our data points (Fig. 4). They appear to be inconsistent with one another. The integrated opacities of the J = 7–6 line, observed in common with both works, differ by a factor of ~ 2, as for their fitted linewidths. Time variablity and/or errors in the spectral baseline could explain the observed differences. We note that the higher S/N J = 7–6 line appears slightly asymmetrical, with a shoulder on the blue-shifted side, reminescent of that of the HCO+ 2–1 profile observed at higher spectral resolution (Muller et al. 2006; Muller & Guélin 2008). This transition was therefore not included in the Gaussian fit to derive the velocity and linewidth.
The points corresponding to the four lines observed by us appear remarkably well-aligned in the rotation diagram, suggesting that the lines are at LTE. They yield a rotation temperature of Trot = 6.3 ± 1.3 K, just slightly higher than the expected CMB temperature. On the other hand, the points corresponding to the lines observed by Henkel et al. (2009) at lower frequencies are not aligned in the rotation diagram. While we cannot discard possible time variations, another explanation could be a change in the source covering factor with frequency, as discussed by Henkel et al. (2009). Observations of all these transitions within a short period of time would help clarify the interpretation of these data.
B.25. C2S
The thioxoethenylidene radical was first identified by Saito et al. (1987) in previous spectra of Sgr B2 and TMC 1, based on laboratory spectroscopy studies. It has been found that C2S is present in translucent clouds (Turner et al. 1998) with a typical abundance of ~10-9 and is detected in the 2 mm survey of NGC 253 by Martín et al. (2006). It is the heaviest species detected in our survey. We measure an abundance of ~2 × 10⁻¹⁰ relative to H2.
Few lines (10 ≥ Ju ≥ 16) of C3S fall within the frequency coverage of our survey. Their non-detection gives a (not tightly constraining) ratio C2S/C3S > 0.7. Search for lower J transitions of C3S would be more sensitive. Fuente et al. (1990) measured a typical abundance ratio C2S/C3S = 5 in dark clouds.
© ESO, 2011
Current usage metrics show cumulative count of Article Views (full-text article views including HTML views, PDF and ePub downloads, according to the available data) and Abstracts Views on Vision4Press platform.
Data correspond to usage on the plateform after 2015. The current usage metrics is available 48-96 hours after online publication and is updated daily on week days.
Initial download of the metrics may take a while.