Fig. A.1
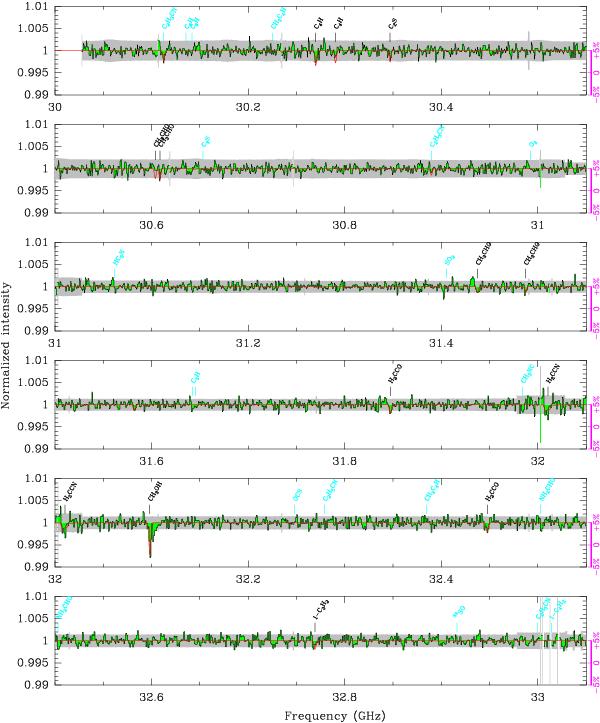
Spectrum of the ATCA 7 mm survey toward PKS 1830 − 211. The grey envelope indicates the 3σ noise level. The LTE synthetic model, assuming Trot = 5.14 K for all molecules, is overlaid in red. The spectrum in magenta, offset at a level of 0.995, gives the relative differences between observations taken in September 2009 and March 2010, normalized to the average spectrum. The corresponding scale is given on the right of each box (±5%). Some non-detections are indicated in light blue.
Current usage metrics show cumulative count of Article Views (full-text article views including HTML views, PDF and ePub downloads, according to the available data) and Abstracts Views on Vision4Press platform.
Data correspond to usage on the plateform after 2015. The current usage metrics is available 48-96 hours after online publication and is updated daily on week days.
Initial download of the metrics may take a while.