Fig. B.1
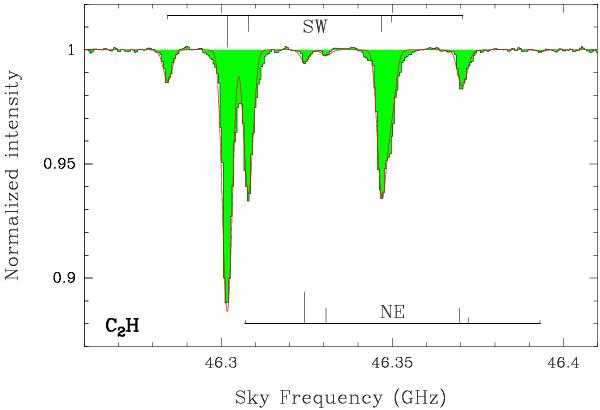
Spectrum of the C2H N = 1–0 line. The different hyperfine components are indicated with their relative intensities for the SW (top) and NE (bottom) absorptions. Note the clear detection of the two strongest hyperfine components arising from FG0.89NE. The red curve shows the LTE synthetic spectrum, taking column densities of 1.3 × 10¹⁵ and 4 × 1013 cm-2 toward the SW and NE images respectively, and a rotation temperature of 5.14 K.
Current usage metrics show cumulative count of Article Views (full-text article views including HTML views, PDF and ePub downloads, according to the available data) and Abstracts Views on Vision4Press platform.
Data correspond to usage on the plateform after 2015. The current usage metrics is available 48-96 hours after online publication and is updated daily on week days.
Initial download of the metrics may take a while.