| Issue |
A&A
Volume 526, February 2011
|
|
|---|---|---|
| Article Number | A19 | |
| Number of page(s) | 14 | |
| Section | The Sun | |
| DOI | https://doi.org/10.1051/0004-6361/201015269 | |
| Published online | 14 December 2010 | |
Online material
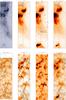 |
Fig. 10
Top, from left to right: TRACE 171 Å image taken at 03:27 UT, XRT image at 03:27 UT, XRT image at 01:01 UT, EIS raster image in Fe xii 195.12 Å obtained between 00:40 UT and 01:21 UT. The TRACE 171 Å, the XRT image at 03:27 UT and the EIS image have the TRACE 171 Å contour overplotted. The XRT image is overplotted with the −100, −50, 50 and 100 G contours of the magnetogram taken at 00:01:01 UT. Bottom, from left to right: TRACE 1550 Å image taken at 03:28 UT, SUMER O v 629.73 Å and S i 1256.49 Å raster images taken between 02:43 UT and 02:56 UT, EIS O v 192.90 Å raster taken from 00:40 to 01:21 UT. The SUMER Si i image is overplotted with the −100, −50, 50 and 100 G contours of the magnetogram taken at 00:01:01 UT. The rest of the images have the TRACE 1550 Å contour superimposed. All the images (top and bottom) are overplotted with the SUMER slit position. The positive polarity ais shown in white and the negative in black colours. |
| Open with DEXTER | |
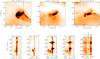 |
Fig. 11
Top: XRT image with superposition of the SUMER slit position, EUVI A and B images during the jet-like phenomenon. Bottom (from left to right): EIS He ii 256.32 Å and Fe xii 195.12 Å spectra along the EIS slit at 01:01:42 UT; SUMER O v and N v spectra along the SUMER slit; and a spectral window comprising C i 1248.0 Å, C i 1249.0 Å, Mg x 624.9 Å taken in second order, Si ii 1250.41 Å and S ii 1250.58 Å (for details on blends and formation temperatures consult Table 1) at 01:01:19 UT. The temporal evolution of as seen in the to three panels is shown in the on-line movie. |
| Open with DEXTER | |
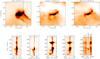 |
Fig. 12
The same as Fig. 11 with EIS at 01:03:46 UT and SUMER at 01:03:26 UT. |
| Open with DEXTER | |
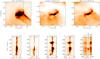 |
Fig. 13
The same as Fig. 11 with EIS at 01:04:48 UT and SUMER at 01:04:26 UT. |
| Open with DEXTER | |
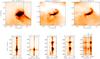 |
Fig. 14
The same as Fig. 11 with EIS at 01:05:50 UT and SUMER at 01:05:32 UT. |
| Open with DEXTER | |
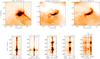 |
Fig. 15
The same as Fig. 11 with EIS at 01:06:52 UT and SUMER at 01:06:32 UT. |
| Open with DEXTER | |
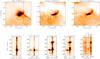 |
Fig. 16
The same as Fig. 11. with EIS at 01:07:54 UT and SUMER at 01:07:40 UT. |
| Open with DEXTER | |
© ESO, 2010
Current usage metrics show cumulative count of Article Views (full-text article views including HTML views, PDF and ePub downloads, according to the available data) and Abstracts Views on Vision4Press platform.
Data correspond to usage on the plateform after 2015. The current usage metrics is available 48-96 hours after online publication and is updated daily on week days.
Initial download of the metrics may take a while.