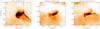
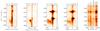
Fig. 11

Top: XRT image with superposition of the SUMER slit position, EUVI A and B images during the jet-like phenomenon. Bottom (from left to right): EIS He ii 256.32 Å and Fe xii 195.12 Å spectra along the EIS slit at 01:01:42 UT; SUMER O v and N v spectra along the SUMER slit; and a spectral window comprising C i 1248.0 Å, C i 1249.0 Å, Mg x 624.9 Å taken in second order, Si ii 1250.41 Å and S ii 1250.58 Å (for details on blends and formation temperatures consult Table 1) at 01:01:19 UT. The temporal evolution of as seen in the to three panels is shown in the on-line movie.
Current usage metrics show cumulative count of Article Views (full-text article views including HTML views, PDF and ePub downloads, according to the available data) and Abstracts Views on Vision4Press platform.
Data correspond to usage on the plateform after 2015. The current usage metrics is available 48-96 hours after online publication and is updated daily on week days.
Initial download of the metrics may take a while.