Fig. 10
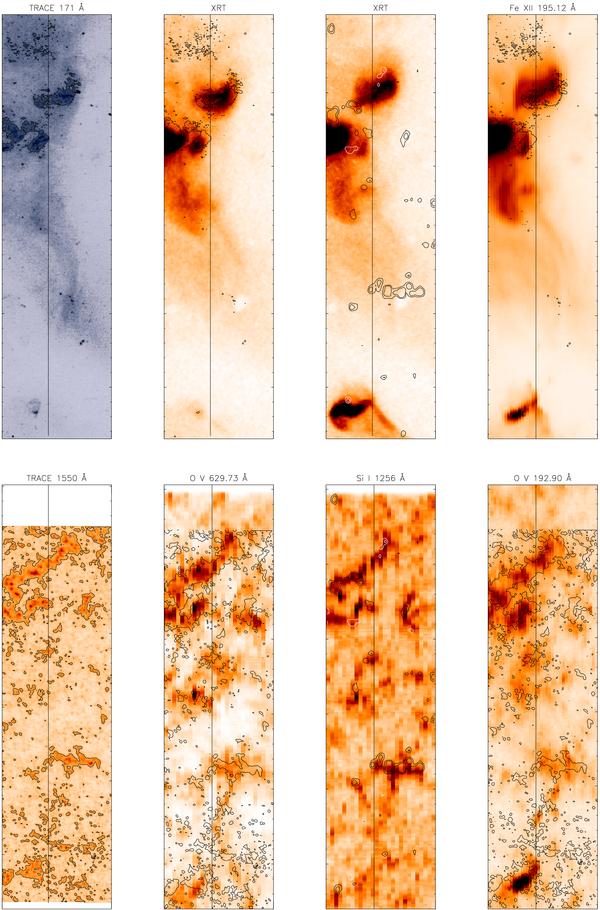
Top, from left to right: TRACE 171 Å image taken at 03:27 UT, XRT image at 03:27 UT, XRT image at 01:01 UT, EIS raster image in Fe xii 195.12 Å obtained between 00:40 UT and 01:21 UT. The TRACE 171 Å, the XRT image at 03:27 UT and the EIS image have the TRACE 171 Å contour overplotted. The XRT image is overplotted with the −100, −50, 50 and 100 G contours of the magnetogram taken at 00:01:01 UT. Bottom, from left to right: TRACE 1550 Å image taken at 03:28 UT, SUMER O v 629.73 Å and S i 1256.49 Å raster images taken between 02:43 UT and 02:56 UT, EIS O v 192.90 Å raster taken from 00:40 to 01:21 UT. The SUMER Si i image is overplotted with the −100, −50, 50 and 100 G contours of the magnetogram taken at 00:01:01 UT. The rest of the images have the TRACE 1550 Å contour superimposed. All the images (top and bottom) are overplotted with the SUMER slit position. The positive polarity ais shown in white and the negative in black colours.
Current usage metrics show cumulative count of Article Views (full-text article views including HTML views, PDF and ePub downloads, according to the available data) and Abstracts Views on Vision4Press platform.
Data correspond to usage on the plateform after 2015. The current usage metrics is available 48-96 hours after online publication and is updated daily on week days.
Initial download of the metrics may take a while.