| Issue |
A&A
Volume 508, Number 1, December II 2009
|
|
|---|---|---|
| Page(s) | 117 - 132 | |
| Section | Extragalactic astronomy | |
| DOI | https://doi.org/10.1051/0004-6361/200912742 | |
| Published online | 15 October 2009 | |
Online Material
Appendix A: SED fits and photometric redshifts
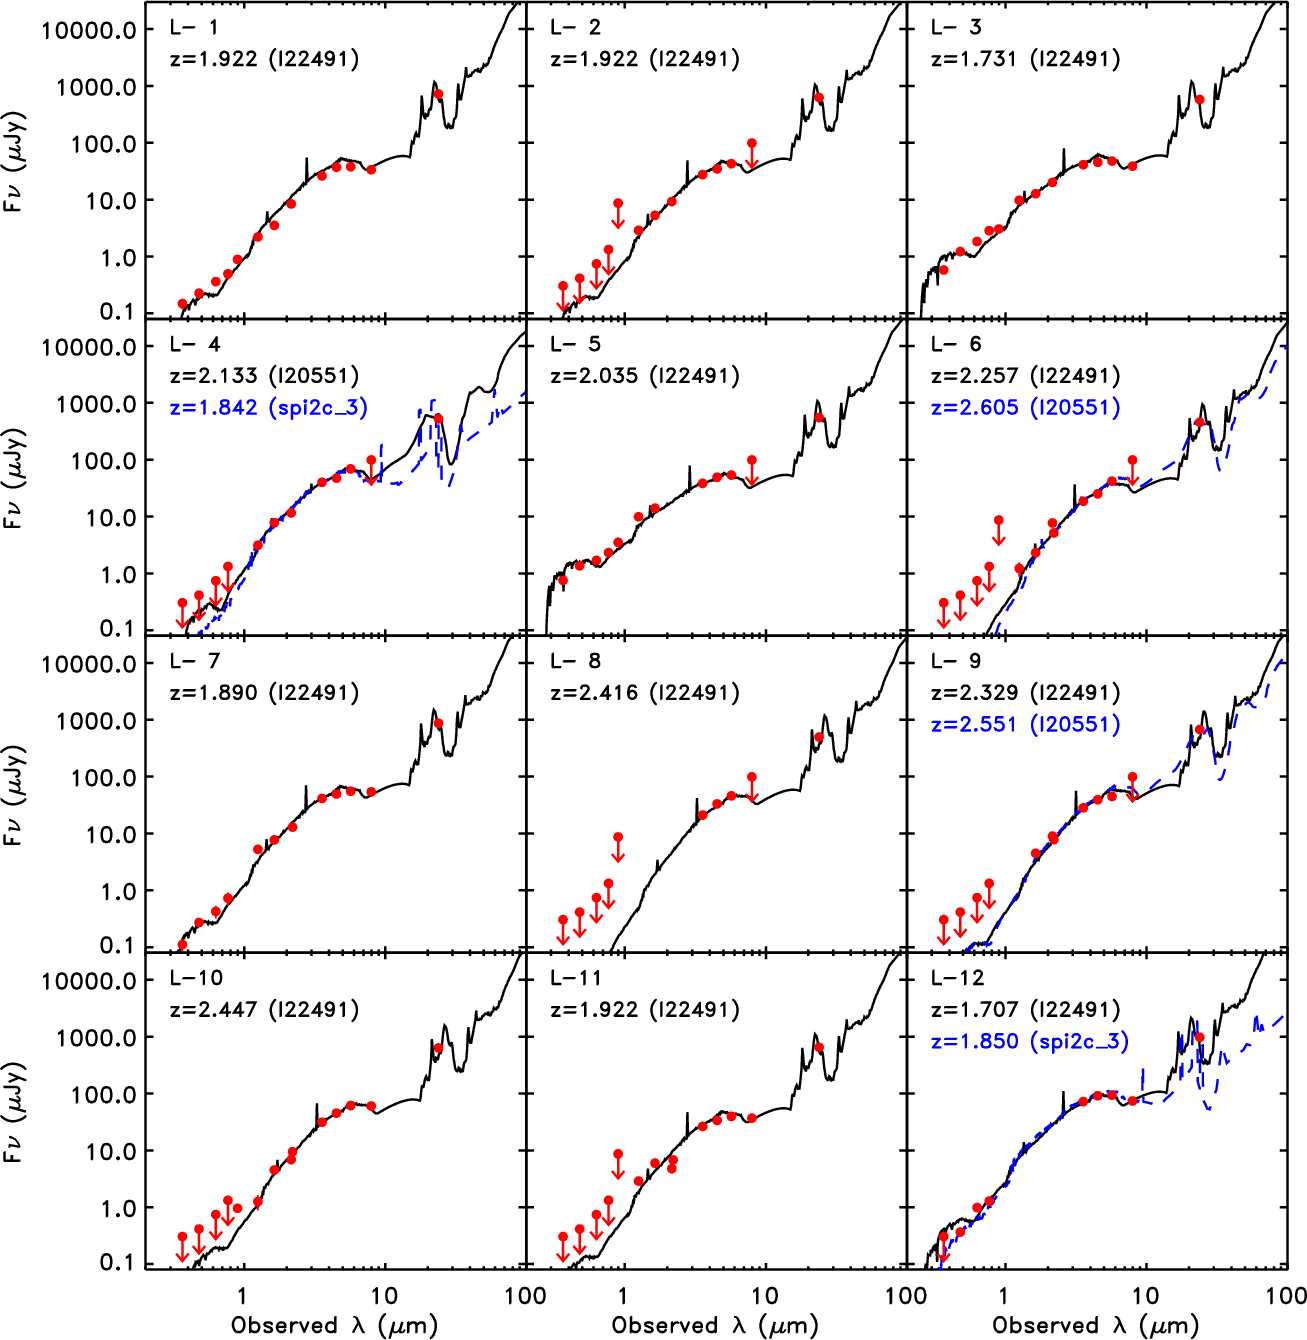
The optical (Ugriz), NIR (JHK), and MIR (3.6-24 ![]() m) SEDs of each
source have been fitted with a library of 18 star-forming galaxy
templates (Polletta et al. 2007) using the H YPER-Z
code (Bolzonella et al. 2000) and the same procedure described
in Lonsdale et al. (2009). In Fig. A.1, we show the optical-IR SED and the best-fit template and
corresponding photometric redshift of each source. In seven cases we also
report a secondary solution corresponding to a second minimum in the
m) SEDs of each
source have been fitted with a library of 18 star-forming galaxy
templates (Polletta et al. 2007) using the H YPER-Z
code (Bolzonella et al. 2000) and the same procedure described
in Lonsdale et al. (2009). In Fig. A.1, we show the optical-IR SED and the best-fit template and
corresponding photometric redshift of each source. In seven cases we also
report a secondary solution corresponding to a second minimum in the ![]() distribution if associated with a different template than the
primary solution. In case a spectroscopic redshift is available
(source L-25), the best-fit template at the spectroscopic redshift
is also reported.
distribution if associated with a different template than the
primary solution. In case a spectroscopic redshift is available
(source L-25), the best-fit template at the spectroscopic redshift
is also reported.
|
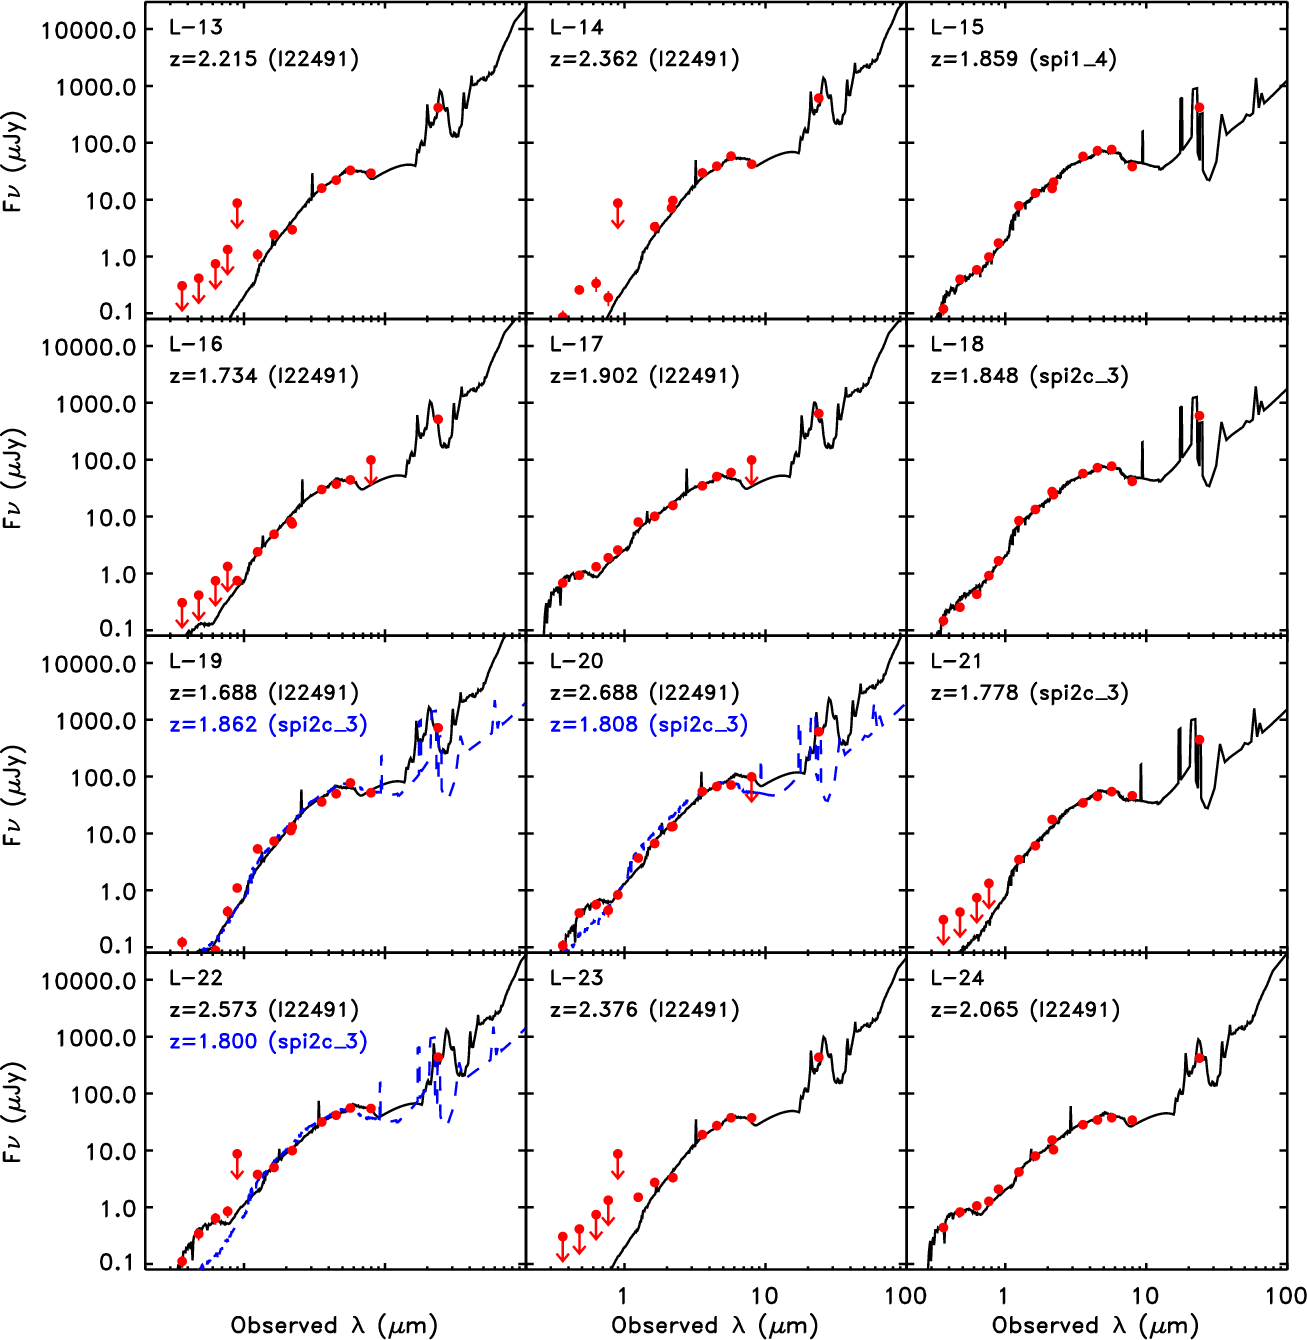
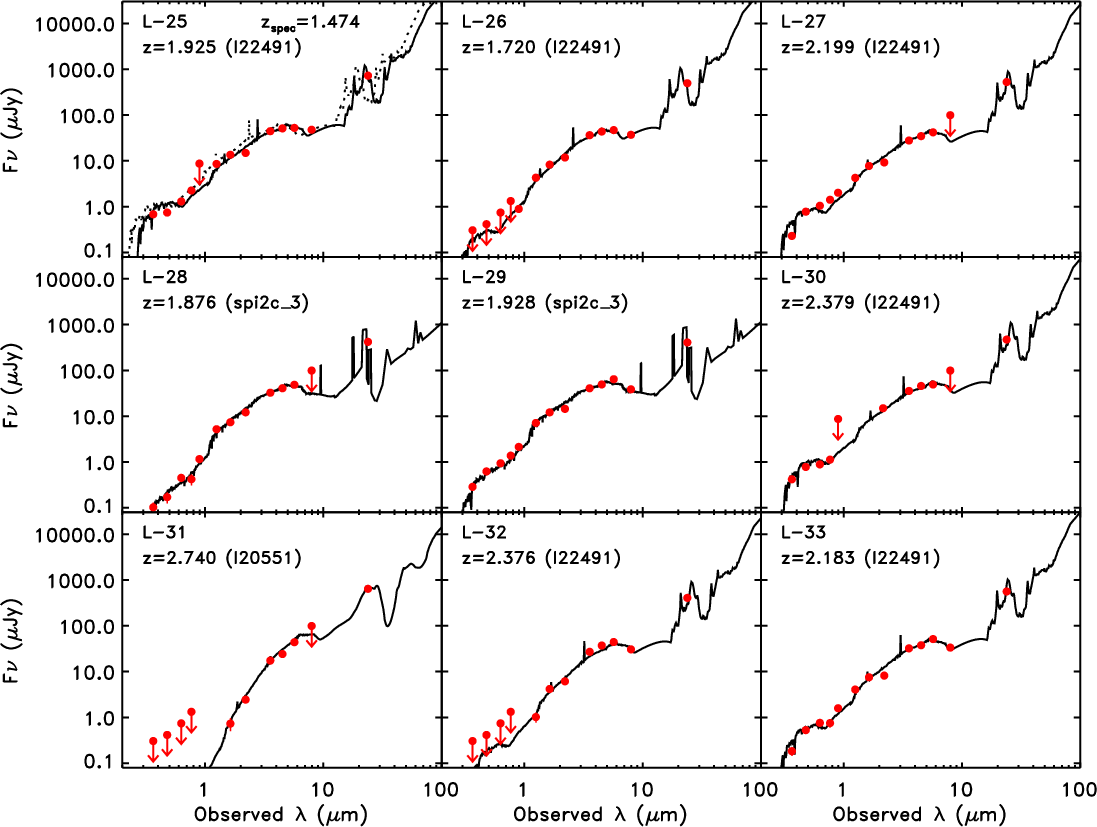
Figure A.1:
Optical-IR SEDs of our sources. The
solid curves represent the best-fit template of the optical-MIR data (up to
24 |
| Open with DEXTER | |
|
Figure A.1: continued. |
| Open with DEXTER | |
|
Figure A.1: continued. |
| Open with DEXTER | |
Current usage metrics show cumulative count of Article Views (full-text article views including HTML views, PDF and ePub downloads, according to the available data) and Abstracts Views on Vision4Press platform.
Data correspond to usage on the plateform after 2015. The current usage metrics is available 48-96 hours after online publication and is updated daily on week days.
Initial download of the metrics may take a while.