


| Issue |
A&A
Volume 711, July 2026
|
|
|---|---|---|
| Article Number | A275 | |
| Number of page(s) | 10 | |
| Section | Cosmology (including clusters of galaxies) | |
| DOI | https://doi.org/10.1051/0004-6361/202659625 | |
| Published online | 21 July 2026 | |
The large cores of dark matter and globular clusters in AS1063: Possible evidence of self-interacting dark matter, or not
Instituto de Física de Cantabria (CSIC-UC), Avda. Los Castros s/n. 39005 Santander, Spain
★ Corresponding author: This email address is being protected from spambots. You need JavaScript enabled to view it.
Received:
26
February
2026
Accepted:
15
June
2026
Abstract
Deep JWST images of AS1063 have revealed tens of thousands of globular clusters in the galaxy cluster AS1063. When compared with the lensing model based on the same JWST data, the distribution of globular clusters is shown to closely trace the distribution of lensing mass (mostly composed of dark matter). Interestingly, the distributions of dark matter and globular clusters are both characterized by large central cores. However, the size of the core in the distribution of globular clusters is about half the size the core in the dark matter distribution. We argue that the standard cold dark matter and fuzzy dark matter models struggle to explain these large cores. Meanwhile, self-interacting dark matter, with a velocity-dependent cross-section, combined with core stalling, offers a natural explanation for the existence of these cores in cases where σSI ≈ 0.3 cm2 g−1 in galaxy cluster halos. However, we also discuss how the lack of hydrodynamical N-body simulations capable of resolving globular clusters in galaxy cluster-scale halos hinders our ability to completely rule out the standard noncollisional dark matter scenario. Future high-resolution hydrodynamical simulations of galaxy clusters, with several trillion particles and containing over a hundred thousand globular clusters, can provide the insights needed to transform the epistemic nature of dark matter into an ontological one.
Key words: galaxies: clusters: general / galaxies: clusters: intracluster medium / dark matter
© The Authors 2026
 Open Access article, published by EDP Sciences, under the terms of the Creative Commons Attribution License (https://creativecommons.org/licenses/by/4.0), which permits unrestricted use, distribution, and reproduction in any medium, provided the original work is properly cited.
This article is published in open access under the Subscribe to Open model. This email address is being protected from spambots. You need JavaScript enabled to view it. to support open access publication.
1. Introduction
Among the biggest, oldest and most intriguing unsolved mysteries in modern cosmology is the nature of dark matter (DM). While the standard (i.e., noncollisional) cold DM (CDM) model has shown a great deal of success in explaining observations from the largest scales probed by the cosmic microwave background (Bahcall et al. 1999; Planck Collaboration VI 2020) to the much smaller scales involved in halo formation (Tegmark et al. 2004), a possible tension could be at play with observations at the smallest scales. Thus, CDM would predict a cusp at the center of the halos, but observations of dwarf galaxies and clusters have revealed the presence of cores (Moore 1994; Tyson et al. 1998). Feedback from supernova (SN) or central active galactic nuclei (AGNs) is often referred to as a possible mechanism to transform the CDM-predicted cusp into a core. However, in dwarf galaxies dominated by DM, this mechanism may be insufficient to explain the relatively large cores found in these galaxies (Moore 1994; de Blok et al. 2001; Kleyna et al. 2003; Oh et al. 2011). Tidal forces may be needed to explain their morphology (Fattahi et al. 2018). Continuous star formation seems also efficient at transforming cusps into cores in dwarf galaxies (Read et al. 2016). On the opposite extreme, in very massive halos, the cores of some observed galaxy clusters are much larger than expectations from simulations, representing a similar challenge for CDM (Tyson et al. 1998; Sand et al. 2002, 2008). Alternative models of DM naturally predict the presence of cores in all halos, from dwarf galaxies to galaxy clusters, thereby offering an interesting alternative to CDM. In models of DM where the DM particle is ultralight (mDM < 10−21 eV), DM behaves as a quantum fluid with fluctuations in the density field at scales corresponding to the de Broglie wavelength of a particle with mass mDM. This type of model is inspired by the axion model in quantum chromodynamics, which was proposed to solve the strong charge conjugation-parity violation, and notably manifested by the incredibly small electric dipole moment of the neutron. In these models, for sufficiently low values of mDM, the associated de Broglie scale becomes astrophysical. These models predict a soliton core at the center of the halos that could explain the observed cores. There are conflicting results in the literature, however, some approaches have favored this type of model (Amruth et al. 2023; Broadhurst et al. 2025; Hou et al. 2026), and sometimes disfavor it (Iršič et al. 2017; Dalal & Kravtsov 2022; Benito et al. 2025). One of the potential key challenges for this type of model is the fact that to explain the observed properties of small halos (dwarf galaxies) and large halos (galaxy clusters), the DM particle cannot have a unique mass; instead, a spectrum of DM particle masses could be required. In addition, there is no clear mechanism explaining how different halos get populated by different DM particles with different masses. It is possible that new physics could govern the dynamics and evolution of these particles, but this is highly speculative and with no real observational nor theoretical evidence to back it up. This type of model has been referred to by a number of names in the literature, but here we simply refer to them as ψDM. An alternative model, which is also physically motivated, is self-interacting DM (or SIDM) (Spergel & Steinhardt 2000; Rocha et al. 2013). Although both ψDM and SIDM can also be considered as particular cases of CDM (since DM is nonrelativistic), the DM particles in SIDM have a small (but nonnegligible and much larger than in the standard CDM model) probability of interacting with each other, characterized by the cross-section σSI . For values of the cross-section, σSI ≈ 1 cm2 g−1, the probability that two DM particles interact in the center of galaxy clusters during a Hubble time is approximately 1. This is sufficient to remove the predicted cusp in CDM models and transform it into a large core. On the much smaller dwarf galaxies, this value of σSI is too small to produce noticeable effects, so σSI should be at least an order of magnitude larger (Vogelsberger et al. 2014; Correa 2021). A model where σSI depends on the mass of the halo (or more precisely, on the typical velocities of the interacting DM particles, with larger velocities in more massive halos) is quite natural and appears in other areas of physics. Moreover, a velocity-dependent σSI naturally solves a different observational characteristic of small versus large halos. Due to the increased probability of interaction in smaller halos, they can experience gravothermal collapse (or core collapse), transforming the SIDM core into a cusp. More massive halos, such as galaxy clusters, do not experience gravothermal collapse during a Hubble time and hence can retain their cores to present time. In dwarf galaxies (often found orbiting around a larger halo), where cores have been observed and where gravothermal collapse should be taking place, the combined effect of feedback and tidal forces from the main halo might be sufficient to disrupt the cusps at the center of the relatively shallow gravitational potentials.
Additional observational tests that can reveal departures from CDM and be better explained with alternative DM models are of paramount importance. An area that has not attracted much attention in relation to DM is the study of globular clusters (GCs) in galaxy clusters, especially from the theoretical or simulation point of view. Given the very compact nature of GCs (a few parsec in size), close encounters between GCs are expected to be incredibly rare in galaxy clusters. Together with their modest masses (105–107 M⊙), GCs are expected to behave as collisionless particles and respond only to the gravitational forces in the cluster, in the same way as DM particles do. Hence, the study of the distribution of GCs and DM in the same cluster may provide valuable clues about the nature of DM.
To date, N-body simulations have not investigated the role that the large number of GCs in a galaxy cluster (∼105) plays with respect to the distribution of dark matter near the center of the cluster halo. This is mainly due to technical limitations. Although they are often seen as the largest linear structures in the universe that reach hydrostatic equilibrium (i.e., virialized), galaxy clusters are sufficiently complex that analytical solutions are not accurate enough; thus, we need to rely on simulations and, in particular, on the more expensive hydrodynamical simulations that take into account the interplay between baryonic physics and the dominant DM. However, N-body simulations that can simultaneously simulate a massive 1015 M⊙ halo (the total mass of AS1063 is estimated to be almost 3 × 10¹⁵ M⊙ Williamson et al. 2011), with a sufficiently large number of particles to resolve 105 M⊙ GCs are incredibly complex. Such a simulation would require a particle mass of less than ∼104 M⊙ to resolve the smallest GCs with at least 10 particles, implying a total number of particles of at least 1012 (or 1016 M⊙ total mass in the simulation box), equivalent to 8 Tb of memory just to store one snapshot. Simulations with more than a trillion particles have already been produced (Maksimova et al. 2021), so a simulation with the required resolution is within the realm of possibility. Only recently have N-body codes managed to simulate a 5 × 10¹⁴ M⊙ galaxy cluster, with a stellar particle mass of 2 × 10⁴ M⊙ and a spatial resolution of 68 pc (Han et al. 2026), much better than the ∼1 kpc resolution of other state-of-the-art simulations. However, even in this case, the resolution may not be sufficient to properly resolve GCs. When compared with lower resolution simulations, no appreciable differences have been observed in certain parameters, such as the density profile (Jeon et al. 2026). High-resolution simulations capable of resolving GCs exist on the much smaller scale of 1012 M⊙ halos, but the number of GCs and mass of the halo is proportionally much smaller (Pfeffer et al. 2018; Reina-Campos et al. 2023). Also, in galaxy cluster scales, we expect some of the objects classified as GCs (basically unresolved sources in the galaxy cluster) to be the massive remnants of galactic cores that can survive strong tidal interactions in the cluster thanks to the super massive black hole (SMBH) at their center. This adds another complication to the simulation and extends the dynamical range of masses of the GCs that should also include the more massive galactic core remnants. To the best of our knowledge at present, such simulations have not yet been carried out so far on galaxy cluster scales, so we are still lacking the intuition and support provided by numerical simulations. Important effects such as dynamical friction or gravothermal collapse of the system of GCs have not been studied on galaxy cluster scales. The gravothermal collapse of the system of GCs is expected to also be a relatively small effect (as compared to the case of stellar clusters) since the probability of two-body relaxation between GCs is much smaller (owing to their relatively low volumetric density and, hence, a very low probability of close encounters) than the stars in a star cluster, where two-body interactions are frequent. As for dynamical friction, this could play an important role. However, dynamical friction should be relatively modest for GCs given their very low mass compared with the cluster mass; thus, it could be relevant only for GCs in the innermost (and most dense) region of the galaxy cluster. However, if the cluster has a core and, as noted by van den Bosch & Dattathri (2026), dynamical friction ceases to operate in cores of (roughly) constant density, a phenomenon known as core stalling (Read et al. 2006; Goerdt et al. 2010; Petts et al. 2015; Kaur & Stone 2022). In flat cores, a reverse phenomenon known as dynamical buoyancy can take place, where massive objects can move outwards from the inner cored region (Cole et al. 2011, 2012; Banik & van den Bosch 2021; Dattathri et al. 2025). This phenomenon is sometimes connected to the formation of corotating Pac-Man orbits around infalling massive objects (e.g., GCs) that can counteract the effect of dynamical friction, imparting a positive torque on the infalling heavy object (Banik & van den Bosch 2022). In SIDM, van den Bosch & Dattathri (2026) shows how neither core stalling, nor dynamical buoyancy take place, but this mechanism of suppressing core stalling and dynamical buoyancy is only efficient when the SIDM cross-sections are greater than the values expected in galaxy clusters. These physical mechanisms have not been explored in detail in galaxy clusters, which could also potentially resolve the much smaller GCs. Furthermore, it is not clear if dynamical buoyancy would take place for objects as small as GCs or if the timescale is as large as the dynamical friction time (larger than the age of the universe for GCs in galaxy clusters). Semi-analytic approaches have been explored (Park et al. 2022), but still lacking the detail provided by true N-body hydrodynamical simulations.
Keeping this context in mind (a relatively unexplored territory), we study the distribution of DM and the system of GCs found around the central region of the massive galaxy cluster AS1063. We discuss it in the context of CDM and alternative DM models. In Diego et al. (2026a) (or paper I), we studied this cluster and derived a new lens model based on recent JWST data. AS1063 is among the best studied gravitational lenses. with tens of lensed galaxies serving as lensing constraints. The distribution of mass in the lens model is dominated by the DM component, so the lens model correlates strongly with the DM distribution. AS1063 is also among the deepest observations carried out with JWST, thus allowing for a detailed view of the system of GCs around a massive galaxy cluster. In a second paper (Diego et al. 2026b, or paper II), we derived the distribution of GCs in AS1063, finding over 30 000 GCs in the inner region, and we studied the correlation with the lens model. This large number of GCs represents only a fraction of the total number of GCs expected in AS1063, which is estimated to host over 105 GCs (Diego et al. 2026b). In general, we have found a very good agreement between the lens model and GC distribution, especially after convolving the distribution of GCs with a kernel that transforms the discrete GC distribution into a continuous one that closely resembles the lensing convergence. In this work, we pay more attention to the differences between the GC and DM distributions in the core region and we discuss them in the context of DM models.
In Section 2, we present the profiles of the GC and DM distribution and briefly discuss their large cores. Section 3 briefly explores the dynamical state of AS1063. Different DM models are explored in Sections 4, 5, and 6. We present our conclusions in Section 7. Throughout the paper, we adopt a standard flat cosmological model with ΩM = 0.3 and h = 0.7. At the redshift of the lens (zl = 0.348), and for this cosmological model in particular, one arcsecond corresponds to 4.921 kpc. For this model, redshift of the lens, and for a source at zs = 3, the critical surface mass density is Σcrit(zl, zs) = 2.086 × 10⁹ M⊙ kpc−2. This quantity enters in the definition of the convergence of the lens model, κ(zl, zs) = Σ/Σcrit(zl, zs).
2. Cores of the GC system and the DM distribution in AS1063
In paper II, we discuss the similarities between the two-dimensional (2D) distributions and one-dimensional (1D) profiles of GCs and the lensing model. This similarity can be exploited to infer the distribution of the invisible DM from the observed distribution of GCs; for instance, by convolving the discrete distribution of GCs with a kernel (see Eq. (2) in paper II) to derive a 2D distribution for the lensing mass. While the connection between GCs and DM is an interesting aspect to consider, it is also compelling to weigh the differences between the GC and lensing mass distributions. We reproduced the lensing mass (or convergence) from paper I (solid dark blue) and GC distribution from paper II (solid black) in Fig. 1. The profile of the number density of GCs was derived from the main JWST module, centered on the cluster and covering radii r < 70″. The second module covered distances 120″ ≲r ≲ 250″. No data were available between 70″ < r < 120″, resulting in a gap in the GC profile. The profiles for the GC number density have been corrected by an estimation of the contamination from foreground galaxies, as described in paper II. At intermediate radii (60″ < r < 150″), we observed that both the lensing mass and GC number density profiles fall close to r−2, which is the expected power law in Navarro-Frenk-White (Navarro et al. 1997) (NFW) profiles for radii that approach the scale radius (300 kpc for the NFW model in Fig. 1). Both profiles also show a relatively large core but the different core sizes is the most obvious difference between the profiles of the GC distribution and the lensing convergence. Different definitions of core sizes can be found in the literature, each one referring to a different profile definition. Here, we use the Burkert profile (Burkert 1995) as our ruler to measure core sizes. In this model, the 3D density profile, ρ(r), and core size, rb, are defined by
 (1)
(1)
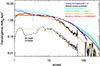 |
Fig. 1. Comparison of the lensing mass and system of GC profiles with analytical models. The dark blue (lensing mass) and black (GCs) lines come from paper I and paper II, respectively. Between 1″ and 3″, the steeper profile in the lensing mass is due to the BCG that dominates the projected mass below 1″, or 4.921 kpc. Above this radius, the projected mass is dominated by DM (and with a small contribution from the X-ray emitting plasma). For the GC, the profile is corrected for background contamination. The solid black curve is rescaled by a factor of 4 to visually match the lensing profile. The light blue curve is an NFW profile that matches the lensing profile in the region constrained by lensing (blue vertical dotted lines). The green line is a PIEMD profile fitting the lensing mass from alternative lens models (see text). The red line is a Burkert profile fitting the lensing mass profile while the orange line is a different Burkert profile fitting the distribution of GCs. The dashed-black is the number density of the brightest GCs in the full sample obtained after increasing the detection threshold by one order of magnitude (and containing 4061 GCs, i.e., one-seventh the total number in the full catalog). The dashed black line includes the same factor of 4 as the black solid line. Finally, the dashed orange line is the same Burkert profile shown as a solid-orange line with rb = 70 kpc, but divided by a factor of 7. |
Burkert profiles are appropriate for cored profiles and can be used in different scenarios. In our case, we used this profile in the context of self-interacting dark matter (SIDM) models, where a core (e.g., in particular, in galaxy clusters that have not had enough time to experience core collapse) is usually expected. On the other hand, cuspy profiles are often described by the classic NFW profile. This type of profile is common in the context of the standard noncollisional CDM scenario. We used both the Burkert and NFW profiles to fit the lensing mass. The results are shown in Fig. 1 as a light blue curve for the NFW case, and the Burkert profile is shown as a red curve. If we ignore the central peak due to the stellar component of the BCG below r = 2″, in the region constrained by lensing (marked with two vertical dotted lines), the Burkert profile fits the lensing convergence better than the NFW. Comparing the analytical profiles with the convergence profile, a classic χ2 statistic (assuming an uncertainty of 5% the value of the lensing convergence) is 1.23 and 6.76 for the Burkert and NFW profiles, respectively, and χ2 is computed for radii 2″ < r < 70″. With the Burkert profile, we measured a core radius of 150 kpc for the DM halo. As discussed in paper I, the lens model profile (dark blue line) is biased low beyond r ≈ 50″ due to lack of lensing constraints at these distances. We see how both the NFW and Burkert profiles are above the lens model at r < 50″ which is consistent with this bias in the lens model at these radii. For comparison, we added a third profile (in green), namely, a pseudo-isothermal mass distribution (or PIEMD, Kassiola & Kovner 1993; Kneib et al. 1996; Limousin et al. 2005) that corresponds to two previously parametric lens models of AS1063 in Bergamini et al. (2019) and Limousin et al. (2022). Both models rely on a PIEMD parameterization for the main DM halo and both determined a similar PIEMD core radius of 90 kpc (see also Granata et al. 2022, who finds a similar PIEMD core radius). For these models, we only plot the main halo component, which is the main contributor to the lensing mass, especially beyond r > 10″.
The central surface density for the Burkert profile, Σo = rbρo, is Σo = 2475 M⊙ pc−2. This is about an order of magnitude larger than the alleged universal value found in galaxies and dwarfs (Donato et al. 2009), as well as higher than the value found in groups by about a factor of 3 (Gopika & Desai 2021), thus confirming the nonuniversality of Σo (Zhou et al. 2020). In addition, we note that the value of Σo is seen to grow with halo mass. Following Bondarenko et al. (2018), we computed the average density, ⟨ρ⟩, and surface density, Σ(r), for the two analytical profiles. For the NFW and at the NFW scale radius, rs = 300 kpc, we find ⟨ρ⟩ = 0.00246 M⊙ pc−3, and for the surface density (see their Eq. (3.2)), we find ΣNFW(rs) = 735 M⊙ pc−2. Similarly, for the Burkert profile and within the smaller core radius of 150 kpc, we find ⟨ρ⟩ = 0.0197 M⊙ pc−3 and ΣB(rb) = 946 M⊙ pc−2. The values of Σ(r) are in good agreement (1σ) with the scaling law (Eq. (3.6) in that paper) for a halo with virial mass of 2 × 10¹⁵ M⊙.
The fact that a similar cored profile in the distribution of DM has also been reported from the independent models of Bergamini et al. (2019), Limousin et al. (2022), and Granata et al. (2022) is reassuring. Apparently. the PIEMD model has a smaller core (90 kpc) than the Burkert model (150 kpc), but this is due to the different definition of a core in the PIEMD and Burkert profiles. Despite this difference in definition, as shown in Fig. 1, both the Burkert (150 kpc core) an PIEMD (90 kpc core) profiles are in excellent agreement with each other in the region constrained by lensing. Here, we use the Burkert core of 150 kpc when we refer to the DM core radius. We also fit the GC (black line) profile with a Burkert profile and find a smaller core of 70 kpc. The Burkert model is shown in this case as a solid orange line in Fig. 1. The fit is not perfect but it is sufficient for our purposes in comparing core sizes obtained with the same ruler: the Burkert profile. The size of the core radius for the GC distribution is significantly larger than the core in the GC distribution of nearby (but less massive) galaxy clusters, where given their low redshift GCs can be more easily detected. For instance, Coma (rb ≈ 20 kpc) or Virgo (rb ≈ 5 kpc) (Peng et al. 2008, 2011) have much smaller cores for their GC system, suggesting that the core radius of the GC system may scale with the halo mass.
To put the DM core in context, we followed Hayashi et al. (2026). We computed the mean surface mass density within r0.01 = 0.01rvmax, where rvmax is the radius at which we find the maximum circular velocity. We computed the maximum circular velocity by the usual  from the NFW profile shown in Fig. 1 (light blue curve) and found a maximum circular velocity vmax = 2115 km s−1 at rvmax = 132″ (in agreement with the expected rvmax = 2.163rs in NFW halos, with rs = 300 kpc for our NFW model). For comparison, using the Burkert profile (Burkert 1995), we find vmax = 2083 km s−1 at rvmax = 99″. This is shown as a red solid line in the same figure. We adopted the NFW value as the most conservative since it gives a higher
  . For the NFW profile we find Σ(r < r0.01) = 2529 M⊙ pc−2, while for the Burkert profile, we find Σ(r < r0.01) = 143 M⊙ pc−2. The value for the Burkert profile (that displays a better fit than the lens model) places this density as an extreme value, below all clusters with vmax > 1500 km s−1 listed in the recent compilation of Hayashi et al. (2026) (see end of their Table 2, see also Umetsu et al. 2016). The value of Σ(r < rvmax) = 143 M⊙ pc−2 is closer to the theoretical model in Kaneda et al. (2024) of a halo that has experienced cusp-to-core transition (see their Figure 4).
Regarding the observed core in the distribution of GCs, these systems in galaxy cluster lenses were studied with HST on relatively low-redshift clusters, such as Abell 1689 (z = 0.183). A similarity between the profiles of the total projected lensing mass (mostly DM) and GCs was already demonstrated (Alamo-Martínez et al. 2013). In that work it is found that the profile of the distribution of GCs falls faster than the lens model profile, similarly to the case of AS1063. Interestingly, a small core of Rc ≈ 20 kpc is found in the distribution of GCs. The total mass model in that work shows a shallow profile in the central region, but no clear evidence of a core. In an earlier work, Halkola et al. (2006) fit a nonsingular isothermal profile to the cluster and estimated a core of ≈70 kpc for the mass profile. A smaller core with size (Rc ≈ 20 kpc) can be appreciated in the more recent lens model of A1689 in Cha & Jee (2022). Studies based on HST are limited due to sensitivity of the telescope to the infrared (where evolved GCs are brightest) and the scarcity of low-redshift cluster lenses. In aged stellar populations, such as those expected in GCs within galaxy clusters, the emission peaks at 1.6 μm in the rest frame of the GC (Sawicki 2002; Muzzin et al. 2013), where HST’s ability to detect point sources is at its worst. Meanwhile, JWST’s larger mirror and sensitivity in the infrared makes it the ideal telescope with which to study GCs in galaxy cluster lenses. A first attempt was made with the very first galaxy cluster observed by JWST, SMACS0723 (Lee et al. 2022; Faisst et al. 2022), quickly followed by a comparison with its lensing mass (Pascale et al. 2022; Mahler et al. 2023; Diego et al. 2023). Many studies of GCs with JWST followed (Harris & Reina-Campos 2023; Martis et al. 2024; D’Abrusco et al. 2026; Harris et al. 2025). Among these, Diego et al. (2023) compares the lens model and GC profiles in SMACS0723. The GC profile is found to fall faster than the total mass (lensing) profile. No core is claimed in neither the GC nor lensing mass profiles. The systems of GCs have been best studied in nearby galaxies, where GCs can be resolved more easily. Of particular interest are dwarf galaxies, where it is found that the system of GCs present a flat core (Cole et al. 2012), similar to the flat, large cores in their dark matter distribution.
In AS1063, the fact that the DM core is approximately twice as large as the core observed in the distribution of GCs is intriguing if we consider that both GCs and DM are expected to behave as collisionless particles, and that no similar result is found in the literature, where both profiles have such large core radii. Dynamical friction would be expected to have a more significant effect on GCs than on the alleged subatomic DM particles and it might also play some role on the higher concentration observed in the GC distribution. However, the presence of a core in the center would make dynamical heating by GCs highly inefficient (see discussion about dynamical friction and core stalling in Sect. 4).
Unlike the cored distribution of the system of GCs, the profile of the system of satellite galaxies (or substructure) shows no core in N-body simulations (Moore et al. 1999a; Nelson et al. 2024). The radial distribution of satellite galaxies in Illustris-TNG in Nelson et al. (2024) shows no core around the center of the simulated or observed clusters. Based on real observations, data from the GAMA survey reveal small cores in the distribution of satellite galaxies of radius ≲20 kpc at the center of clusters (Riggs et al. 2022). In the same work, the authors reported that in the range 20 kpc < r < 500 kpc, the number density of satellite galaxies falls to ∼r−1. No core was observed either in the distribution of DM in the ultra-high-resolution NewCluster simulation Han et al. (2026), Jeon et al. (2026). This and other state-of-the-art very high resolution simulations of galaxy clusters are still at least one order of magnitude above the particle mass resolution, along with a greater softening length of around several orders of magnitude than what would be required to simulate GCs in galaxy clusters (Steinwandel et al. 2024).
As mentioned in the introduction, lack of N-body simulations that can simultaneously simulate massive 1015 M⊙ galaxy clusters and resolve small, 105 M⊙, GCs hinders our ability to properly contextualize the difference in core radii between the GC and DM distributions. Before discussing the different scenarios and earlier works that could help us gain insights into the reasons behind the difference in core radii, we briefly discuss the dynamical state of AS1063.
3. Dynamical state of AS1063
X-ray Chandra data reveal a very hot cluster (kT > 11.5 keV). Based on the morphology of the X-ray emission and the high temperature, AS1063 was originally interpreted as a postmerger cluster (Gómez et al. 2012). The postmerger scenario was also suggested by studies of the intracluster light (de Oliveira et al. 2022) and, more recently, by a joint lensing, X-ray, and kinematics study in Beauchesne et al. (2024). The postmerger scenario is supported as well by the presence of a radio halo Xie et al. (2020), with a steep spectrum more consistent with turbulence reacceleration (merger-induced turbulence reaccelerates cosmic ray electrons) than a hadronic model (proton-proton collisions reaccelerates cosmic ray electrons) (Rahaman et al. 2021). Detailed analyses combining X-ray and radio data provide evidence of both a postmerger and a more relaxed scenario, with some observational features resembling a cold core typical of relaxed clusters (Rahaman et al. 2021). This suggests that AS1063 has experienced a merger in the past (i.e., not recently) and it is currently in the process of reaching equilibrium.
We can search for further evidence in the JWST images. Specifically, the isochrones around the BCG at 25% and 50% the peak flux at the center of the BCG are very symmetric and well described by ellipses (dashed lines in Fig. 2). The centers of these ellipses are perfectly aligned with the peak emission at the BCG’s center. To highlight small structures in the central region, we applied the same filtering process to the short-wavelength bands of JWST images as in Diego et al. (2026b). The resulting filtered image is shown in Fig. 2. At the very center of the BCG, we found a compact source that coincides with the peak emission in JWST images. This source is allegedly the SMBH expected at the minimum of the potential well. The SMBH is found less than 30 milliarcseconds away from the center of the ellipse models fitting the light distribution. Given the lack of offset between the center of the light emission (or stellar component) and the SMBH, and the nearly perfect elliptical shape of the isochrones, we found no evidence of sloshing of the stellar component around the minimum of the potential, which would have pointed to a recent merger episode. Hence, we conclude that the cluster central region is already (or close to being in) a relaxed state.
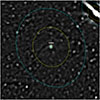 |
Fig. 2. Central 3″ × 3″ region of AS1063 (filtered). The image is obtained after applying two high-pass filters to the F090W, F115W, F150W, and F200W images (see Diego et al. 2026a, for details), then combining the four filtered images into a single one. Many GCs can be seen in the image with an almost uniform number density. The yellow and cyan solid lines are the light contours in the raw F356W image at 50% and 25%, respectively, of the maximum intensity in the center. The yellow and cyan dashed curves are ellipses fitting the corresponding solid lines. The small yellow and cyan circles near the bright central source are the corresponding centers of the two ellipses. The bright source near the center is at the position of the peak emission in the raw images and it is likely the central SMBH. |
Finally, and relevant for the discussion in the next section, the filtered JWST images show no evidence of a resolved binary SMBH that could play a role on heating up the central region (scouring by a binary SMBH, see Postman et al. 2012). However, this possibility cannot be ruled out. While the detected SMBH may have emission around it from a compact cusp of stars (dress) or a small accretion disk, the companion SMBH (invisible in JWST images) may be a naked (no dress) and quiescent SMBH.
4. The case for CDM
The CDM scenario has been studied extensively with N-body simulations, which have generally predicted a cusp at the center of massive halos (Navarro et al. 1997; Moore et al. 1999b; Springel 2005; Diemand et al. 2005; Stadel et al. 2009; Navarro et al. 2010; Laporte & White 2015; Haggar et al. 2021; Ishiyama et al. 2021). This is in tension with the large cores observed in massive clusters such as AS1063. Large cores in galaxy clusters have previously reported in other clusters (Tyson et al. 1998; Rau et al. 2014; Lagattuta et al. 2017; Limousin et al. 2026; Monna et al. 2017). It is unclear how large cores are produced in galaxy clusters in the context of CDM. In smaller systems, such as dwarf galaxies, the shallower potential makes it easier for stellar feedback processes (supernova-driven outflows) to produce large cores (Mashchenko et al. 2008; de Blok 2010; Chan et al. 2015; Read et al. 2019); whereas for larger halos, this mechanism is less efficient (Di Cintio et al. 2014; Tollet et al. 2016; Lazar et al. 2020; Dekel et al. 2021).
As discussed in the previous section, AS1063 shows signs of a past merger, although it also hints at a near-equilibrium state. Mergers are a possible mechanism to produce cores, especially after two SMBHs sink to the center of the halo forming a SMBH binary, inducing three body interactions, or SMBH scouring. These mechanisms can efficiently expel lighter material (stars and DM) from the central region (Makino & Ebisuzaki 1996; Goerdt et al. 2010; Postman et al. 2012; Bonfini & Graham 2016; Nasim et al. 2021; Khonji et al. 2024). However, this effect is often restricted to small scales (a few kpc on cluster scales) and it does not explain why the distribution of light (stars) shows a much more compact configuration (core radius of few kpc, see Fig. 2) than the radial distribution of GCs or DM. Extrapolating the results from Rusli et al. (2013), a core size of 150 kpc would imply a SMBH mass of at least ≈8.5 × 10¹¹ M⊙ (using the most conservative reverse model in Table 5 of the cited work) or more than three times the expected upper limit for an accreting (and rotating) SMBH (King 2016); however, we note that a SMBH more massive than this limit could certainly form via a merger process.
An alternative way of looking at mergers is by focusing on clusters that have experienced a recent violent merger. Perhaps one of the most extreme cases is the Bullet cluster Markevitch et al. (2004) given its mass, high relative velocity between groups, and small impact parameter during the interaction. Recent lens models have reconstructed the inner profile with great accuracy. Both Cha et al. (2025), Rihtaršič et al. (2026) found that the inner 50 kpc profiles are cuspy−not flat for both the main cluster and the Bullet subgroup. Perhaps the Bullet cluster is observed too close to the crossing of the two groups and not enough time has passed for relaxation to have modified the mass profiles. An interesting insight comes from Faltenbacher et al. (2006), who traced the central density during a major merger as a function of time. As expected, there is an oscillatory pattern in the central density as the two groups cross each other, but the most distinguishing feature is a momentary increase by ≈30% (lasting a few hundred million years) in the central density, followed by a return to a value of the central density close to the one before the interaction. The most intense change takes place during the first peri-center passage, with the effect diminishing in subsequent peri-center passages. As the merger evolves, the general trend for the central density is to increase, not decrease (see also Zemp et al. 2008). The final merged halo in Faltenbacher et al. (2006) has a central cusp, in agreement with other N-body simulations that also report cusps surviving cluster mergers, as we explore below.
Simulations of dry mergers of two clusters find that mergers are relatively ineffective at changing the central densities of halos. In these simulations, the remnant remembers the density profiles of the two clusters before merging, with the profile of the remnant being cuspy if one (or both) of the two original clusters is cuspy, while a cored profile after a merger is obtained only if both clusters possessed a core before the merger (Boylan-Kolchin & Ma 2004; Dehnen 2005; Kazantzidis et al. 2006; McMillan et al. 2007; Zemp et al. 2008; Nipoti et al. 2009; Vass et al. 2009; Drakos et al. 2019a,b). Hence, in the merger scenario discussed earlier, a cored profile can only be obtained (in collisionless DM models) if the two groups had large cores before merging. Moreover, adiabatic contraction could result in even more cuspy halos than in DM-only simulations, compensating and, in some cases reversing, baryonic effects that can reduce the central density (Peirani et al. 2017). Mergers can momentarily redistribute DM near the center of the halo with the DM density profiles becoming shallower than NFW, but the total mass density profiles (baryons plus dark matter) still resemble that of an NFW (Laporte & White 2015).
In contrast, wet mergers, combined with dynamical friction, could be more efficient at flattening the inner slope of the profile, although this has been closely studied only on galaxy scale mergers (El-Zant et al. 2001; Hashim et al. 2024). Semianalytic works have shown that mergers involving a very compact satellite plus AGN feedback can be effective at transforming cusps into cores (Dekel et al. 2021). This view is challenged by N-body simulations of wet mergers where large amounts of cold gas can dynamically heat the DM cusp and transform it into a core, while keeping the profile of the total mass cuspy as the baryons replace the displaced DM at the center (Ogiya & Nagai 2022). In very massive galaxy clusters, it is unclear how this mechanism would operate since cold gas cannot survive the extreme (hot) environment of galaxy cluster cores. Runaway cooling flows at the very center are efficient at bringing large amounts of gas into the cluster center, which can later feed the central AGN providing feedback to heat up the core, although the AGN itself may heat up the infalling gas and stop the cooling flow (Li et al. 2015; Guo et al. 2018). Assuming AGN activity does not stop the inflow of cold gas, together with dynamical friction, AGN feedback would be able to flatten the inner region, but this would result in cores of a few tens of kpc in size at most (El-Zant et al. 2004; Del Popolo 2009; Governato et al. 2012; Martizzi et al. 2013), significantly smaller than the 150 kpc core observed in AS1063. Hence, mergers and feedback seem insufficient to explain the large core observed in AS1063. Other dynamical effects must be at play in the case of CDM to heat up the central region of the cluster.
The dynamical friction of GCs that are stripped early on in the outskirts of the cluster is expected to play a minor role in shaping the profile of the distribution of GCs. For an isothermal model, the Chandrasekhar time for dynamical friction is very long and exceeding the age of the universe for a GC being accreted at the virial radius. This follows from the scaling of this time, tdyn ∝ r2Mhalo/MGC (Lacey & Cole 1993), which is very large at the virial radius of a cluster halo and for a much smaller (lighter) GC. From the same scaling, we see that this time decreases rapidly at small radii, r, so dynamical friction effects on GCs are only expected to play some role at small radii. GCs can be brought to the central region by their host galaxies, for which the dynamical time is several orders of magnitude smaller, and later get stripped away from their hosts by tidal forces that are stronger near the galaxy cluster center (especially at the pericenter). Then in the core region, dynamical friction effects become more important. Of course, the discussion above assumes the GCs observed by JWST in AS1063 have typical masses for GCs (105 M⊙ < MGC < 107 M⊙), but as mentioned in the introduction, at least some (or even many) of these GCs are expected to be the surviving nucleus of member galaxies that have their envelopes stripped away by the cluster. In this case, the GCs could be much more massive, especially if they harbor a SMBH. For these very massive GCs, we would expect dynamical friction to be much more effective. The bright sample of GCs in Fig. 1 (black dashed line) shows a core of similar dimension to the full sample (black solid line). Since these objects are presumed to be more massive, dynamical effects may play some role here.
The in situ formation of GCs near the center of the galaxy cluster could also explain the presence of a core in the distribution of GCs. This is, however, an unlikely mechanism to produce large numbers of GCs near the center. Observations reveal that in-situ formation is only prevalent on small halos, with larger halos having most of their GCs accreted Trujillo-Gomez et al. (2023).
As mentioned in the discussion, one of the standing issues is the lack of N-body simulations that have the sufficient resolution to resolve the smallest substructures present in the cluster and, in particular, GCs. Earlier works have attempted to study GCs via cluster-scale simulated halos, but still lacked the resolution needed to resolve GCs in the numbers observed in real galaxy clusters. In the study of Ramos-Almendares et al. (2018), a modest galaxy cluster halo was simulated with particle masses already exceeding the mass of a GC. The GCs were added a posteriori in the simulation (via particle tagging) (see also Ramos et al. 2015). The simulation shows how the spatial distribution of the GC is steeper than that of DM. Neither the DM nor GC distributions show a core, as seen in other CDM simulations. A follow-up work based on the Illustris simulation increases the particle resolution, but still without resolving individual GCs (Ramos-Almendares et al. 2020). As in earlier works, GCs are assigned to individual particles in the simulation based on the local density. In terms of profiles, the results are similar to what is previously reported. The GC distribution shows a profile steeper than DM and neither the DM or GCs have cores in their spatial distribution. A steep profile without an apparent core is also observed in the spatial distribution of GCs in Doppel et al. (2023). As in previous simulations, GCs can be simulated via particle tagging in a post-processing step. Interestingly, based on this work and for very small galaxies (dwarfs), we find that a core in the distribution of GCs is apparent after stacking several dwarf galaxies in Doppel et al. (2023). However, these simulations do not capture the subtle nuances in the interaction between the very large number of GCs and DM particles. Regarding observations of GC systems, a small core in the distribution of GCs appears also in observations of dwarfs galaxies (Carlsten et al. 2022). In more massive galaxies, Caso et al. (2019), De Bórtoli et al. (2022) studies of early-type galaxies have found cored distributions for the GC systems. A useful scaling is derived in Caso et al. (2019) between the core radius and the stellar mass of the galaxy or velocity dispersion. Extrapolating to a galaxy cluster scale, the core radius of the GC systems should be between 10 kpc and 20 kpc. Dynamical friction and core stalling is more efficient in the shallow potentials of smaller galaxies, but it is harder to achieve in the much more massive galaxy clusters, where the timescale of dynamical friction is much larger. However, the galaxies hosting the GCs are subject to dynamical friction and they can transport the GCs into the inner region of the cluster before being disrupted by tidal forces, leaving the GCs much closer to the central region. Alternatively, the compact nuclei of the host galaxies can survive interactions with the galaxy cluster, leaving behind a graveyard of GC-like structures near the galaxy cluster center. This hypothesis can be tested in the future with high-resolution simulations.
It is also possible that the abundant population of compact GCs (i.e., more abundant by several orders of magnitude than the subhalos in current N-body simulation) is efficient at dynamically heating the cusp and transforming it into a large core. Despite the lack of simulations on galaxy cluster scales, we can gain some intuition from simulations on smaller halos. On galaxy scales, Boldrini et al. (2021) found that the accretion of satellites with highly eccentric orbits can heat up the central parts of halos, causing an outward migration of DM particles and transforming the central cusp into a core (see also Boldrini et al. 2020a, for a similar study but with primordial black holes). Another interesting study was carried out by Boldrini et al. (2020b), where the heating mechanism by GCs proposed earlier was found to be efficient at flattening the cusp and producing a core. However, in that work, the main halo is a dwarf galaxy and the GCs are embedded in DM minihalos that are twenty times more massive than the stellar component of the GC. It is unclear whether these halos can survive the strong tidal forces present in the inner regions of galaxy clusters, but the result is enticing. On even smaller scales, simulations of star clusters with different star masses (and remnants) do predict the formation of a core in star clusters, which is in good agreement with observations (Mackey & Gilmore 2003; Baumgardt 2017). On aspect that is particularly interesting for our aims comes from simulations where a fraction of the objects are significantly more massive than the rest; for instance, in the case of black hole (BH) remnants from massive stars. Mackey et al. (2008) (see also Mackey et al. 2007) simulated star clusters with a population of stellar BHs with masses that are ≈20 times larger than the typical mass of the rest of regular stars in the GC. In that case, the regular stars play the role of the much lighter DM particle, while the BHs play the role of the massive GCs in AS1063. In those simulations, we can see how an initial core radius of 1.9 pc (Runs 1 and 2) increases to ≈7 pc due to dynamical heating from the BHs. It is tempting to think that a similar mechanism is taking place in AS1063, given the numerous GCs in the central region heating up the core of the much lighter DM particles. This possibility begs the question of why such a phenomenon is not observed in CDM N-body simulations of massive galaxy clusters that contain thousands of subhalos with a similar capacity to heat up the central cusp and transform it into a larger core. Perhaps the answer lies again in the limited resolution of these simulations, since the number of GCs that needs to be considered is approximately two orders of magnitude larger than the number of subhalos included in typical N-body simulations. In addition, CGs are much more compact than the haloes in CDM simulations and hence are able to survive close encounters with the center of the galaxy cluster and remain in close orbits around the halo center, instead of evaporating into the main halo. Although this is an interesting possibility that should be addressed with future simulations, the results from Mackey et al. (2008) cannot be taken at face value for a galaxy cluster with a system of ∼105 GCs, since mechanisms such as two-body relaxation or mass segregation, do not take place (or are much less efficient) in galaxy clusters, as they do in star clusters. For instance, mass segregation is not observed in the distribution of GCs in AS1063. This is shown in Fig. 1 as a dashed line, which represents the number density of bright (or more massive) GCs, rescaled by the same factor of 4. This profile corresponds to the brightest (i.e., more massive) 4061 GCs in our catalog (or approximately one-seventh the size of the full sample). This profile is well described by the same Burkert profile with core radius 70 kpc, but divided by a factor of 7. If mass segregation was taking place, we would expect this profile to have a noticeably smaller core radius. The decrease in surface number density between 2″ and 5″ is interesting and statistically significant, especially given the fact that these objects are the brightest and easier to detect, so they are in principle not affected by incompleteness. Interpreting this feature is beyond the scope of this paper but it is intriguing enough to motivate future work.
In the classic CDM context, the large (but different) cores in the GC and DM distributions could represent an example of a “chicken and egg” scenario. The similarity in profiles between the GC and DM distributions suggest that they are interconnected, but the question is which core was created first; alternatively, we might ask whether there is any positive feedback mechanism at work between the two cores, making them both grow over time. The larger DM core could be a consequence of the GC system heating up the core or the observed cored distribution of GCs could be tracing the larger DM core. Since dynamical friction becomes inefficient for GCs in a core (core stalling Read et al. 2006; Goerdt et al. 2010; Kaur & Stone 2022; Banik & van den Bosch 2022; Modak et al. 2023; van den Bosch & Dattathri 2026; Di Cintio & Marcos 2025), we could imagine the distribution of GCs as a history record of past mergers, with GCs near the center being accreted earlier (and remaining in nearly constant orbits due to core stalling) and the last accreted GCs remaining closer to the boundaries of the DM core, which grows over time, as the already accreted GCs may prevent the core from transforming into a cusp. This is reasonable in the commonly accepted picture where the less gravitationally bound DM halo is being tidally stripped first from the infalling satellite galaxies, the more tightly bound GCs are removed afterwards, and stars (occupying the minimum in the potential well of the satellite galaxies) are accreted last (Smith et al. 2016; Martin et al. 2026), ending up closer to the center of the cluster (i.e., the BCG). While dynamical friction may stop in galaxy cluster cores, its place can be taken by dynamical buoyancy (Cole et al. 2011, 2012; Banik & van den Bosch 2021; Dattathri et al. 2025). This phenomenon would push GCs outwards into new orbits where an equilibrium between dynamical friction and buoyancy can be reached again (and, hence, similar to core stalling). We might naively expect that the core in the system of GCs would then be similar to the core in the distribution of DM, which is contrary to the case in AS1063. However, it is unclear whether this mechanism is efficient for GCs and/or for the timescale needed. To draw a firm conclusion on the ability of CDM models to reproduce the observed cores in the CG and DM distributions of AS1063, the picture above should be tested with high-resolution N-body simulations that can resolve the small, but very numerous GCs. Such simulations do not exist yet, but given the rapid evolution of this field, we expect them to become available in the near future.
5. The case for SIDM
A SIDM interpretation for this cluster offers a natural explanation for the puzzling situation presented by the smaller core observed in the distribution of GCs. Since GCs are expected to behave as truly noninteractive particles, their cross-sections should be smaller than for SIDM and they should serve good tracers of the gravitational potential. The smaller core in the GC distribution may be explained by the core stalling mechanism and continuous mergers discussed in the previous section. Recently, van den Bosch & Dattathri (2026) showed that in SIDM models, when the cross-section for self-interactions, σSI, is high, then core stalling (and dynamical buoyancy) are not present. Yet, in galaxy clusters and for velocity-dependent cross-sections, σSI is so small that these mechanisms can still take place. However, this assumption has only been tested with relatively small N-body simulations. Similarly to the CDM case, detailed N-body simulations (this time in the SIDM scenario) resolving the large population of GCs in galaxy clusters are lacking; thus, it is not clear whether a core radius for the GC distribution that is about half the size of the core radius for the DM distribution would remain consistent with the SIDM case. The SIDM scenario is also in good agreement with the apparent deficit of member galaxies (subhalos) near the center of the halo, a characteristic that is easier to interpret with the stronger ram pressure stripping caused by self-interactions with the cluster in the case of SIDM (Nagai & Kravtsov 2005; Nadler et al. 2020; Sirks et al. 2022).
Overall, CDM also seems to struggle with lensing observations with subhalos that are apparently more efficient at lensing than would be expected from simulations (Meneghetti et al. 2020). This might be explained in the context of SIDM, where the increase in lensing efficiency of subhalos is due to gravothermal core collapse, which is more likely to take place in the subhalos if σSI reveals a dependency on the velocity of the DM particles (Fischer et al. 2025; Natarajan et al. 2026).
Following Rocha et al. (2013), we can estimate the Burkert core radius for a SIDM model with σSI = 1 cm2 g−1 via
 (2)
(2)
This is about a factor of 2.7 times larger than the value obtained for AS1063 so we conclude that σSI < 1 cm2 g−1
Interpolating the core radii found in Rocha et al. (2013) for σSI = 0.1 cm2 g−1 and σSI = 1 cm2 g−1, we find that σSI ≈ 0.3 cm2 g−1 should produce a Burkert core size rb ≈ 150 kpc for a halo with vmax ≈ 2000 km s−1. This is comfortably below the limit set by the Bullet cluster of σSI ≲ 1 cm2 g−1 (Markevitch et al. 2004; Randall et al. 2008), but above the recent upper limits in Jee et al. (2026), σSI ≲ 0.22 cm2 g−1, where radio relics were used as as cosmic clocks along with BCG positions to probe σSI (see also Fischer et al. 2023). Other recent works have also reported similarly low upper limits on σSI (Andrade et al. 2022; Eckert et al. 2022)
Ultimately, SIDM is an attractive possibility for explaining the large cores of DM and GCs in AS1063. The flat DM cores predicted by SIDM in galaxy clusters provide the conditions for dynamical friction and buoyancy to find a balance that can result in a similarly cored distribution for the GCs. While SIDM offers a plausible solution for AS1063, this does not resolve the question of why some clusters show large cores and some do not. Due to the large velocities, and relatively late formation history, galaxy cluster scale halos are not expected to reach the gravothermal collapse phase during a Hubble time. Detailed lensing models in other clusters find a variety of slopes in the center of clusters, with some clusters resembling NFW-like profiles while other show large cores. (Tyson et al. 1998; Rau et al. 2014; Lagattuta et al. 2017; Limousin et al. 2026; Monna et al. 2017). To add to the confusion, some merging clusters exhibit significantly different profiles in each of the subclusters. For instance, in A370 the south subcluster has a cental DM cusp while the northern subcluster has a large core (Diego et al. 2025), with the inner region (r < 20 kpc) dominated by the stellar component. Perhaps the velocity dependence of σSIDM can offer a solution to this conundrum if the velocity dispersion can be reduced by some mechanism near the center of some halos, thereby increassing the probability of interaction and reducing the central density; this, in turn could reduce the velocity even further, resulting in a runaway process that flattens the core. This process could be followed by gravothermal collapse in some cases, similar to the mechanisms invoked for galaxy-scale halos, resulting in the formation of a new cusp.
6. The case for ψDM
Another model that predicts cores in the center of halos is ψDM (Peebles 2000; Goodman 2000; Hu et al. 2000; Schive et al. 2014a; Marsh 2016; Schive 2026). Although there are models available that allow for different masses for the DM particle to coexist in the same halo (see for example, Luu et al. 2025), in this work, we assume the simplest (and most popular) scenario of just one species or a single field. The size of the core is linked to the de Broglie wavelength of the ψDM particle, λdB, determined by the mass of the DM particle and and the halo mass. For a 1015 M⊙ halo and mψ = 10−22 eV, λdB = 15 pc (Broadhurst et al. 2025). N-body simulations have shown how the size of the core scales with the halo mass as Rc ∝ Mh−1/3, resulting in a core for AS1063 of less than 1 kpc for the same model above (Schive et al. 2014b). A much smaller DM particle mass, mψ ∼ 10−26 eV, would be needed to explain the core on AS1063, but this mass is clearly ruled out by observations (Marsh 2016; Benito et al. 2025). Hence, based on simple scaling relations, ψDM does not offer a valid solution for the core of AS1063.
An interesting property of ψDM models is the random walk by the soliton. Together with the constantly changing ψDM fluctuations around the soliton, massive particles moving near the center can be diffused outwards in a process that resembles the dynamical buoyancy discussed previously Dutta Chowdhury et al. (2021). This aspect has been studied on much smaller halos (galaxies and dwarf galaxies), for which the soliton and core radii, as well as the mass of the granules, are at relatively large values. For galaxy clusters, the ψDM fluctuations are smaller (albeit more numerous owing to the smaller λdB), so the diffusion mechanism is not expected to be as effective.
7. Conclusions
In this work, we discuss the large cores found in AS1063 for its rich system of GCs as well as for the lensing mass (mostly DM). Thanks to the exceptional depth of JWST observations and the large number of lensing constraints in AS1063 within the core radius (approximately half the lensing constraints fall within 150 kpc), the existence and scale of the core radii for both GCs and DM are well established. We measured the core sizes for the DM and GC distributions and found that the DM has a core that is approximately twice as large as the GC distribution (150 kpc, vs. 70 kpc). Since both GCs and DM are expected to behave as collisionless particles in the standard CDM model, the presence of the much larger core size in the lensing mass is puzzling. We have investigated the possibility of mergers, feedback, and dynamical effects in making sense of this phenomenon and found that such large core for the DM distribution is difficult to explain in the standard CDM scenario. The observed DM core is also much larger than the one predicted in ψDM models with axion mass mψ ≈ 10−22 eV and would require a much smaller axion mass; however, this has already ruled out by other observations. In contrast, the existence of such a large core in the DM can be explained in SIDM models with a velocity-dependent cross-section. For the scale (velocity) of a galaxy cluster, a cross-section of σSI ≈ 0.3 cm2 g−1 predicts a DM core with roughly the same size as the observed one. Despite the apparent success of the SIDM model, we also argue that our results are inconclusive due to the lack of high resolution N-body CDM simulations of galaxy clusters with a large number (∼105) of 105–106 M⊙ GCs, which prevents us from ruling out CDM. We argue that such large number of GCs, accreted continuously during the formation of the cluster, along with the core stalling that freezes the GCs orbits as they enter the DM core, might be able to produce both a large core for the GC distribution and an even larger core for the DM, with collisionless DM particles.
Acknowledgments
The author thanks G. Yepes, Shashank Dattathri, Moritz Fischer, Tom Broadhurst, Ben Moore, and the anonymous referee for useful comments. J.M.D. acknowledges the support of projects PID2022-138896NB-C51 (MCIU/AEI/MINECO/FEDER, UE) Ministerio de Ciencia, Investigación y Universidades and SA101P24. This work is based on observations made with the NASA/ESA/CSA James Webb Space Telescope. The data were obtained from the Mikulski Archive for Space Telescopes at the Space Telescope Science Institute, which is operated by the Association of Universities for Research in Astronomy, Inc., under NASA contract NAS 5-03127 for JWST. These observations are associated with JWST program #3293. All the JWST data used in this paper can be found in MAST: https://www.doi.org/10.17909/01wz-ng35
References
- Alamo-Martínez, K. A., Blakeslee, J. P., Jee, M. J., et al. 2013, ApJ, 775, 20 [CrossRef] [Google Scholar]
- Amruth, A., Broadhurst, T., Lim, J., et al. 2023, Nat. Astron., 7, 736 [NASA ADS] [CrossRef] [Google Scholar]
- Andrade, K. E., Fuson, J., Gad-Nasr, S., et al. 2022, MNRAS, 510, 54 [Google Scholar]
- Bahcall, N. A., Ostriker, J. P., Perlmutter, S., & Steinhardt, P. J. 1999, Science, 284, 1481 [NASA ADS] [CrossRef] [Google Scholar]
- Banik, U., & van den Bosch, F. C. 2021, ApJ, 912, 43 [NASA ADS] [CrossRef] [Google Scholar]
- Banik, U., & van den Bosch, F. C. 2022, ApJ, 926, 215 [NASA ADS] [CrossRef] [Google Scholar]
- Baumgardt, H. 2017, MNRAS, 464, 2174 [Google Scholar]
- Beauchesne, B., Clément, B., Hibon, P., et al. 2024, MNRAS, 527, 3246 [Google Scholar]
- Benito, M., Hütsi, G., Müürsepp, K., et al. 2025, Phys. Dark Universe, 49, 102010 [Google Scholar]
- Bergamini, P., Rosati, P., Mercurio, A., et al. 2019, A&A, 631, A130 [NASA ADS] [CrossRef] [EDP Sciences] [Google Scholar]
- Boldrini, P., Miki, Y., Wagner, A. Y., et al. 2020a, MNRAS, 492, 5218 [Google Scholar]
- Boldrini, P., Mohayaee, R., & Silk, J. 2020b, MNRAS, 492, 3169 [NASA ADS] [CrossRef] [Google Scholar]
- Boldrini, P., Mohayaee, R., & Silk, J. 2021, ApJ, 919, 86 [Google Scholar]
- Bondarenko, K., Boyarsky, A., Bringmann, T., & Sokolenko, A. 2018, JCAP, 2018, 049 [CrossRef] [Google Scholar]
- Bonfini, P., & Graham, A. W. 2016, ApJ, 829, 81 [NASA ADS] [CrossRef] [Google Scholar]
- Boylan-Kolchin, M., & Ma, C.-P. 2004, MNRAS, 349, 1117 [Google Scholar]
- Broadhurst, T., Li, S. K., Alfred, A., et al. 2025, ApJ, 978, L5 [Google Scholar]
- Burkert, A. 1995, ApJ, 447, L25 [NASA ADS] [Google Scholar]
- Carlsten, S. G., Greene, J. E., Beaton, R. L., & Greco, J. P. 2022, ApJ, 927, 44 [NASA ADS] [CrossRef] [Google Scholar]
- Caso, J. P., De Bórtoli, B. J., Ennis, A. I., & Bassino, L. P. 2019, MNRAS, 488, 4504 [NASA ADS] [CrossRef] [Google Scholar]
- Cha, S., & Jee, M. J. 2022, ApJ, 931, 127 [CrossRef] [Google Scholar]
- Cha, S., Cho, B. Y., Joo, H., et al. 2025, ApJ, 987, L15 [Google Scholar]
- Chan, T. K., Kereš, D., Oñorbe, J., et al. 2015, MNRAS, 454, 2981 [NASA ADS] [CrossRef] [Google Scholar]
- Cole, D. R., Dehnen, W., & Wilkinson, M. I. 2011, MNRAS, 416, 1118 [NASA ADS] [CrossRef] [Google Scholar]
- Cole, D. R., Dehnen, W., Read, J. I., & Wilkinson, M. I. 2012, MNRAS, 426, 601 [Google Scholar]
- Correa, C. A. 2021, MNRAS, 503, 920 [NASA ADS] [CrossRef] [Google Scholar]
- D’Abrusco, R., Mirabile, M., Cantiello, M., et al. 2026, ApJ, 996, 67 [Google Scholar]
- Dalal, N., & Kravtsov, A. 2022, Phys. Rev. D, 106, 063517 [NASA ADS] [CrossRef] [Google Scholar]
- Dattathri, S., van den Bosch, F. C., Banik, U., et al. 2025, ArXiv e-prints [arXiv:2511.11804] [Google Scholar]
- de Blok, W. J. G. 2010, Adv. Astron., 2010, 789293 [CrossRef] [Google Scholar]
- de Blok, W. J. G., McGaugh, S. S., Bosma, A., & Rubin, V. C. 2001, ApJ, 552, L23 [Google Scholar]
- De Bórtoli, B. J., Caso, J. P., Ennis, A. I., & Bassino, L. P. 2022, MNRAS, 510, 5725 [CrossRef] [Google Scholar]
- de Oliveira, N. O. L., Jiménez-Teja, Y., & Dupke, R. 2022, MNRAS, 512, 1916 [NASA ADS] [CrossRef] [Google Scholar]
- Dehnen, W. 2005, MNRAS, 360, 892 [Google Scholar]
- Dekel, A., Freundlich, J., Jiang, F., et al. 2021, MNRAS, 508, 999 [NASA ADS] [CrossRef] [Google Scholar]
- Del Popolo, A. 2009, ApJ, 698, 2093 [Google Scholar]
- Di Cintio, P., & Marcos, B. 2025, A&A, 700, A230 [NASA ADS] [CrossRef] [EDP Sciences] [Google Scholar]
- Di Cintio, A., Brook, C. B., Macciò, A. V., et al. 2014, MNRAS, 437, 415 [Google Scholar]
- Diego, J. M., Pascale, M., Frye, B., et al. 2023, A&A, 679, A159 [NASA ADS] [CrossRef] [EDP Sciences] [Google Scholar]
- Diego, J. M., Sun, F., Palencia, J. M., et al. 2025, A&A, 703, A207 [NASA ADS] [CrossRef] [EDP Sciences] [Google Scholar]
- Diego, J. M., Palencia, J. M., Goolsby, C., et al. 2026a, A&A, submitted [arXiv:2601.11704] [Google Scholar]
- Diego, J. M., Goolsby, C., Conselice, C. J., & Palencia, J. M. 2026b, A&A, 709, A248 [NASA ADS] [CrossRef] [EDP Sciences] [Google Scholar]
- Diemand, J., Zemp, M., Moore, B., Stadel, J., & Carollo, C. M. 2005, MNRAS, 364, 665 [NASA ADS] [CrossRef] [Google Scholar]
- Donato, F., Gentile, G., Salucci, P., et al. 2009, MNRAS, 397, 1169 [Google Scholar]
- Doppel, J. E., Sales, L. V., Nelson, D., et al. 2023, MNRAS, 518, 2453 [Google Scholar]
- Drakos, N. E., Taylor, J. E., Berrouet, A., Robotham, A. S. G., & Power, C. 2019a, MNRAS, 487, 993 [Google Scholar]
- Drakos, N. E., Taylor, J. E., Berrouet, A., Robotham, A. S. G., & Power, C. 2019b, MNRAS, 487, 1008 [Google Scholar]
- Dutta Chowdhury, D., van den Bosch, F. C., Robles, V. H., et al. 2021, ApJ, 916, 27 [CrossRef] [Google Scholar]
- Eckert, D., Ettori, S., Robertson, A., et al. 2022, A&A, 666, A41 [NASA ADS] [CrossRef] [EDP Sciences] [Google Scholar]
- El-Zant, A., Shlosman, I., & Hoffman, Y. 2001, ApJ, 560, 636 [NASA ADS] [CrossRef] [Google Scholar]
- El-Zant, A. A., Hoffman, Y., Primack, J., Combes, F., & Shlosman, I. 2004, ApJ, 607, L75 [NASA ADS] [CrossRef] [Google Scholar]
- Faisst, A. L., Chary, R. R., Brammer, G., & Toft, S. 2022, ApJ, 941, L11 [NASA ADS] [CrossRef] [Google Scholar]
- Faltenbacher, A., Gottloeber, S., & Mathews, W. G. 2006, ArXiv e-prints [arXiv:astro-ph/0609615] [Google Scholar]
- Fattahi, A., Navarro, J. F., Frenk, C. S., et al. 2018, MNRAS, 476, 3816 [Google Scholar]
- Fischer, M. S., Durke, N.-H., Hollingshausen, K., et al. 2023, MNRAS, 523, 5915 [CrossRef] [Google Scholar]
- Fischer, M. S., Yu, H.-B., & Dolag, K. 2025, A&A, 703, A234 [NASA ADS] [CrossRef] [EDP Sciences] [Google Scholar]
- Goerdt, T., Moore, B., Read, J. I., & Stadel, J. 2010, ApJ, 725, 1707 [Google Scholar]
- Gómez, P. L., Valkonen, L. E., Romer, A. K., et al. 2012, AJ, 144, 79 [CrossRef] [Google Scholar]
- Goodman, J. 2000, New Astron., 5, 103 [NASA ADS] [CrossRef] [Google Scholar]
- Gopika, K., & Desai, S. 2021, Phys. Dark Universe, 33, 100874 [Google Scholar]
- Governato, F., Zolotov, A., Pontzen, A., et al. 2012, MNRAS, 422, 1231 [Google Scholar]
- Granata, G., Mercurio, A., Grillo, C., et al. 2022, A&A, 659, A24 [NASA ADS] [CrossRef] [EDP Sciences] [Google Scholar]
- Guo, F., Duan, X., & Yuan, Y.-F. 2018, MNRAS, 473, 1332 [NASA ADS] [CrossRef] [Google Scholar]
- Haggar, R., Pearce, F. R., Gray, M. E., Knebe, A., & Yepes, G. 2021, MNRAS, 502, 1191 [NASA ADS] [CrossRef] [Google Scholar]
- Halkola, A., Seitz, S., & Pannella, M. 2006, MNRAS, 372, 1425 [Google Scholar]
- Han, S., Yi, S. K., Dubois, Y., et al. 2026, A&A, 705, A169 [NASA ADS] [CrossRef] [EDP Sciences] [Google Scholar]
- Harris, W. E., & Reina-Campos, M. 2023, MNRAS, 526, 2696 [NASA ADS] [CrossRef] [Google Scholar]
- Harris, W. E., Reina-Campos, M., Koekemoer, A. M., et al. 2025, ApJ, 991, 7 [Google Scholar]
- Hashim, M., El-Zant, A. A., & Del Popolo, A. 2024, MNRAS, 529, 2702 [Google Scholar]
- Hayashi, K., Kaneda, Y., Mori, M., & Shinozaki, M. 2026, PASJ, 78, 745 [Google Scholar]
- Hou, S., Xiang, S., Sming Tsai, Y.-L., et al. 2026, ArXiv e-prints [arXiv:2601.16818] [Google Scholar]
- Hu, W., Barkana, R., & Gruzinov, A. 2000, Phys. Rev. Lett., 85, 1158 [NASA ADS] [CrossRef] [Google Scholar]
- Iršič, V., Viel, M., Haehnelt, M. G., Bolton, J. S., & Becker, G. D. 2017, Phys. Rev. Lett., 119, 031302 [CrossRef] [Google Scholar]
- Ishiyama, T., Prada, F., Klypin, A. A., et al. 2021, MNRAS, 506, 4210 [NASA ADS] [CrossRef] [Google Scholar]
- Jee, M. J., Park, D., & Lee, W. 2026, ArXiv e-prints [arXiv:2605.00093] [Google Scholar]
- Jeon, S., Contini, E., Han, S., et al. 2026, ApJ, 998, 30 [Google Scholar]
- Kaneda, Y., Mori, M., & Otaki, K. 2024, PASJ, 76, 1026 [Google Scholar]
- Kassiola, A., & Kovner, I. 1993, ApJ, 417, 450 [Google Scholar]
- Kaur, K., & Stone, N. C. 2022, MNRAS, 515, 407 [Google Scholar]
- Kazantzidis, S., Zentner, A. R., & Kravtsov, A. V. 2006, ApJ, 641, 647 [NASA ADS] [CrossRef] [Google Scholar]
- Khonji, N., Gualandris, A., Read, J. I., & Dehnen, W. 2024, ApJ, 974, 204 [NASA ADS] [CrossRef] [Google Scholar]
- King, A. 2016, MNRAS, 456, L109 [CrossRef] [Google Scholar]
- Kleyna, J. T., Wilkinson, M. I., Gilmore, G., & Evans, N. W. 2003, ApJ, 588, L21 [NASA ADS] [CrossRef] [Google Scholar]
- Kneib, J.-P., Ellis, R. S., Smail, I., Couch, W. J., & Sharples, R. M. 1996, ApJ, 471, 643 [Google Scholar]
- Lacey, C., & Cole, S. 1993, MNRAS, 262, 627 [NASA ADS] [CrossRef] [Google Scholar]
- Lagattuta, D. J., Richard, J., Clément, B., et al. 2017, MNRAS, 469, 3946 [Google Scholar]
- Laporte, C. F. P., & White, S. D. M. 2015, MNRAS, 451, 1177 [NASA ADS] [CrossRef] [Google Scholar]
- Lazar, A., Bullock, J. S., Boylan-Kolchin, M., et al. 2020, MNRAS, 497, 2393 [NASA ADS] [CrossRef] [Google Scholar]
- Lee, M. G., Bae, J. H., & Jang, I. S. 2022, ApJ, 940, L19 [NASA ADS] [CrossRef] [Google Scholar]
- Li, Y., Bryan, G. L., Ruszkowski, M., et al. 2015, ApJ, 811, 73 [Google Scholar]
- Limousin, M., Kneib, J.-P., & Natarajan, P. 2005, MNRAS, 356, 309 [Google Scholar]
- Limousin, M., Beauchesne, B., & Jullo, E. 2022, A&A, 664, A90 [NASA ADS] [CrossRef] [EDP Sciences] [Google Scholar]
- Limousin, M., Beauchesne, B., Sharon, K., et al. 2026, A&A, 711, A143 [NASA ADS] [CrossRef] [EDP Sciences] [Google Scholar]
- Luu, H. N., Mocz, P., Vogelsberger, M., et al. 2025, Phys. Rev. D, 111, L121302 [Google Scholar]
- Mackey, A. D., & Gilmore, G. F. 2003, MNRAS, 338, 85 [Google Scholar]
- Mackey, A. D., Wilkinson, M. I., Davies, M. B., & Gilmore, G. F. 2007, MNRAS, 379, L40 [NASA ADS] [CrossRef] [Google Scholar]
- Mackey, A. D., Wilkinson, M. I., Davies, M. B., & Gilmore, G. F. 2008, MNRAS, 386, 65 [NASA ADS] [CrossRef] [Google Scholar]
- Mahler, G., Jauzac, M., Richard, J., et al. 2023, ApJ, 945, 49 [CrossRef] [Google Scholar]
- Makino, J., & Ebisuzaki, T. 1996, ApJ, 465, 527 [CrossRef] [Google Scholar]
- Maksimova, N. A., Garrison, L. H., Eisenstein, D. J., et al. 2021, MNRAS, 508, 4017 [NASA ADS] [CrossRef] [Google Scholar]
- Markevitch, M., Gonzalez, A. H., Clowe, D., et al. 2004, ApJ, 606, 819 [NASA ADS] [CrossRef] [Google Scholar]
- Marsh, D. J. E. 2016, Phys. Rep., 643, 1 [NASA ADS] [CrossRef] [Google Scholar]
- Martin, G., Pearce, F. R., Hatch, N. A., et al. 2026, MNRAS, 548, stag649 [Google Scholar]
- Martis, N. S., Sarrouh, G. T. E., Willott, C. J., et al. 2024, ApJ, 975, 76 [NASA ADS] [CrossRef] [Google Scholar]
- Martizzi, D., Teyssier, R., & Moore, B. 2013, MNRAS, 432, 1947 [NASA ADS] [CrossRef] [Google Scholar]
- Mashchenko, S., Wadsley, J., & Couchman, H. M. P. 2008, Science, 319, 174 [NASA ADS] [CrossRef] [Google Scholar]
- McMillan, P. J., Athanassoula, E., & Dehnen, W. 2007, MNRAS, 376, 1261 [Google Scholar]
- Meneghetti, M., Davoli, G., Bergamini, P., et al. 2020, Science, 369, 1347 [Google Scholar]
- Modak, S., Danieli, S., & Greene, J. E. 2023, ApJ, 950, 178 [Google Scholar]
- Monna, A., Seitz, S., Balestra, I., et al. 2017, MNRAS, 466, 4094 [NASA ADS] [Google Scholar]
- Moore, B. 1994, Nature, 370, 629 [NASA ADS] [CrossRef] [Google Scholar]
- Moore, B., Ghigna, S., Governato, F., et al. 1999a, ApJ, 524, L19 [Google Scholar]
- Moore, B., Quinn, T., Governato, F., Stadel, J., & Lake, G. 1999b, MNRAS, 310, 1147 [NASA ADS] [CrossRef] [Google Scholar]
- Muzzin, A., Wilson, G., Demarco, R., et al. 2013, ApJ, 767, 39 [NASA ADS] [CrossRef] [Google Scholar]
- Nadler, E. O., Banerjee, A., Adhikari, S., Mao, Y.-Y., & Wechsler, R. H. 2020, ApJ, 896, 112 [NASA ADS] [CrossRef] [Google Scholar]
- Nagai, D., & Kravtsov, A. V. 2005, ApJ, 618, 557 [Google Scholar]
- Nasim, I. T., Gualandris, A., Read, J. I., et al. 2021, MNRAS, 502, 4794 [NASA ADS] [CrossRef] [Google Scholar]
- Natarajan, P., Chiang, B. T., & Dutra, I. 2026, ApJ, 1001, L12 [Google Scholar]
- Navarro, J. F., Frenk, C. S., & White, S. D. M. 1997, ApJ, 490, 493 [Google Scholar]
- Navarro, J. F., Ludlow, A., Springel, V., et al. 2010, MNRAS, 402, 21 [Google Scholar]
- Nelson, D., Pillepich, A., Ayromlou, M., et al. 2024, A&A, 686, A157 [NASA ADS] [CrossRef] [EDP Sciences] [Google Scholar]
- Nipoti, C., Treu, T., & Bolton, A. S. 2009, ApJ, 703, 1531 [Google Scholar]
- Ogiya, G., & Nagai, D. 2022, MNRAS, 514, 555 [Google Scholar]
- Oh, S.-H., de Blok, W. J. G., Brinks, E., Walter, F., & Kennicutt, R. C., Jr. 2011, AJ, 141, 193 [Google Scholar]
- Park, S.-M., Shin, J., Smith, R., & Chun, K. 2022, ApJ, 941, 91 [Google Scholar]
- Pascale, M., Frye, B. L., Diego, J., et al. 2022, ApJ, 938, L6 [NASA ADS] [CrossRef] [Google Scholar]
- Peebles, P. J. E. 2000, ApJ, 534, L127 [NASA ADS] [CrossRef] [Google Scholar]
- Peirani, S., Dubois, Y., Volonteri, M., et al. 2017, MNRAS, 472, 2153 [NASA ADS] [CrossRef] [Google Scholar]
- Peng, E. W., Jordán, A., Côté, P., et al. 2008, ApJ, 681, 197 [NASA ADS] [CrossRef] [Google Scholar]
- Peng, E. W., Ferguson, H. C., Goudfrooij, P., et al. 2011, ApJ, 730, 23 [Google Scholar]
- Petts, J. A., Gualandris, A., & Read, J. I. 2015, MNRAS, 454, 3778 [NASA ADS] [CrossRef] [Google Scholar]
- Pfeffer, J., Kruijssen, J. M. D., Crain, R. A., & Bastian, N. 2018, MNRAS, 475, 4309 [Google Scholar]
- Planck Collaboration VI. 2020, A&A, 641, A6 [NASA ADS] [CrossRef] [EDP Sciences] [Google Scholar]
- Postman, M., Lauer, T. R., Donahue, M., et al. 2012, ApJ, 756, 159 [Google Scholar]
- Rahaman, M., Raja, R., Datta, A., et al. 2021, MNRAS, 505, 480 [NASA ADS] [CrossRef] [Google Scholar]
- Ramos, F., Coenda, V., Muriel, H., & Abadi, M. 2015, ApJ, 806, 242 [Google Scholar]
- Ramos-Almendares, F., Abadi, M., Muriel, H., & Coenda, V. 2018, ApJ, 853, 91 [NASA ADS] [CrossRef] [Google Scholar]
- Ramos-Almendares, F., Sales, L. V., Abadi, M. G., et al. 2020, MNRAS, 493, 5357 [Google Scholar]
- Randall, S. W., Markevitch, M., Clowe, D., Gonzalez, A. H., & Bradač, M. 2008, ApJ, 679, 1173 [NASA ADS] [CrossRef] [Google Scholar]
- Rau, S., Vegetti, S., & White, S. D. M. 2014, MNRAS, 443, 957 [CrossRef] [Google Scholar]
- Read, J. I., Goerdt, T., Moore, B., et al. 2006, MNRAS, 373, 1451 [NASA ADS] [CrossRef] [Google Scholar]
- Read, J. I., Agertz, O., & Collins, M. L. M. 2016, MNRAS, 459, 2573 [NASA ADS] [CrossRef] [Google Scholar]
- Read, J. I., Walker, M. G., & Steger, P. 2019, MNRAS, 484, 1401 [NASA ADS] [CrossRef] [Google Scholar]
- Reina-Campos, M., Trujillo-Gomez, S., Pfeffer, J. L., et al. 2023, MNRAS, 521, 6368 [NASA ADS] [CrossRef] [Google Scholar]
- Riggs, S. D., Loveday, J., Thomas, P. A., et al. 2022, MNRAS, 514, 4676 [NASA ADS] [CrossRef] [Google Scholar]
- Rihtaršič, G., Bradač, M., Desprez, G., et al. 2026, A&A, 710, A207 [NASA ADS] [CrossRef] [EDP Sciences] [Google Scholar]
- Rocha, M., Peter, A. H. G., Bullock, J. S., et al. 2013, MNRAS, 430, 81 [NASA ADS] [CrossRef] [Google Scholar]
- Rusli, S. P., Erwin, P., Saglia, R. P., et al. 2013, AJ, 146, 160 [CrossRef] [Google Scholar]
- Sand, D. J., Treu, T., & Ellis, R. S. 2002, ApJ, 574, L129 [Google Scholar]
- Sand, D. J., Treu, T., Ellis, R. S., Smith, G. P., & Kneib, J.-P. 2008, ApJ, 674, 711 [NASA ADS] [CrossRef] [Google Scholar]
- Sawicki, M. 2002, AJ, 124, 3050 [Google Scholar]
- Schive, H.-Y. 2026, Liv. Rev. Comput. Astrophys., 12, 1 [Google Scholar]
- Schive, H.-Y., Chiueh, T., & Broadhurst, T. 2014a, Nat. Phys., 10, 496 [NASA ADS] [CrossRef] [Google Scholar]
- Schive, H.-Y., Liao, M.-H., Woo, T.-P., et al. 2014b, Phys. Rev. Lett., 113, 261302 [NASA ADS] [CrossRef] [Google Scholar]
- Sirks, E. L., Oman, K. A., Robertson, A., Massey, R., & Frenk, C. 2022, MNRAS, 511, 5927 [Google Scholar]
- Smith, R., Choi, H., Lee, J., et al. 2016, ApJ, 833, 109 [NASA ADS] [CrossRef] [Google Scholar]
- Spergel, D. N., & Steinhardt, P. J. 2000, Phys. Rev. Lett., 84, 3760 [NASA ADS] [CrossRef] [Google Scholar]
- Springel, V. 2005, MNRAS, 364, 1105 [Google Scholar]
- Stadel, J., Potter, D., Moore, B., et al. 2009, MNRAS, 398, L21 [NASA ADS] [CrossRef] [Google Scholar]
- Steinwandel, U. P., Dolag, K., Böss, L. M., & Marin-Gilabert, T. 2024, ApJ, 967, 125 [NASA ADS] [CrossRef] [Google Scholar]
- Tegmark, M., Strauss, M. A., Blanton, M. R., et al. 2004, Phys. Rev. D, 69, 103501 [CrossRef] [Google Scholar]
- Tollet, E., Macciò, A. V., Dutton, A. A., et al. 2016, MNRAS, 456, 3542 [CrossRef] [Google Scholar]
- Trujillo-Gomez, S., Kruijssen, J. M. D., Pfeffer, J., et al. 2023, MNRAS, 526, 5735 [Google Scholar]
- Tyson, J. A., Kochanski, G. P., & Dell’Antonio, I. P. 1998, ApJ, 498, L107 [Google Scholar]
- Umetsu, K., Zitrin, A., Gruen, D., et al. 2016, ApJ, 821, 116 [Google Scholar]
- van den Bosch, F. C., & Dattathri, S. 2026, Open J. Astrophys., 9, 57701 [Google Scholar]
- Vass, I. M., Kazantzidis, S., Valluri, M., & Kravtsov, A. V. 2009, ApJ, 698, 1813 [Google Scholar]
- Vogelsberger, M., Zavala, J., Simpson, C., & Jenkins, A. 2014, MNRAS, 444, 3684 [CrossRef] [Google Scholar]
- Williamson, R., Benson, B. A., High, F. W., et al. 2011, ApJ, 738, 139 [NASA ADS] [CrossRef] [Google Scholar]
- Xie, C., van Weeren, R. J., Lovisari, L., et al. 2020, A&A, 636, A3 [NASA ADS] [CrossRef] [EDP Sciences] [Google Scholar]
- Zemp, M., Moore, B., Stadel, J., Carollo, C. M., & Madau, P. 2008, MNRAS, 386, 1543 [Google Scholar]
- Zhou, Y., Del Popolo, A., & Chang, Z. 2020, Phys. Dark Universe, 28, 100468 [Google Scholar]
All Figures
|
Fig. 1. Comparison of the lensing mass and system of GC profiles with analytical models. The dark blue (lensing mass) and black (GCs) lines come from paper I and paper II, respectively. Between 1″ and 3″, the steeper profile in the lensing mass is due to the BCG that dominates the projected mass below 1″, or 4.921 kpc. Above this radius, the projected mass is dominated by DM (and with a small contribution from the X-ray emitting plasma). For the GC, the profile is corrected for background contamination. The solid black curve is rescaled by a factor of 4 to visually match the lensing profile. The light blue curve is an NFW profile that matches the lensing profile in the region constrained by lensing (blue vertical dotted lines). The green line is a PIEMD profile fitting the lensing mass from alternative lens models (see text). The red line is a Burkert profile fitting the lensing mass profile while the orange line is a different Burkert profile fitting the distribution of GCs. The dashed-black is the number density of the brightest GCs in the full sample obtained after increasing the detection threshold by one order of magnitude (and containing 4061 GCs, i.e., one-seventh the total number in the full catalog). The dashed black line includes the same factor of 4 as the black solid line. Finally, the dashed orange line is the same Burkert profile shown as a solid-orange line with rb = 70 kpc, but divided by a factor of 7. |
| In the text | |
|
Fig. 2. Central 3″ × 3″ region of AS1063 (filtered). The image is obtained after applying two high-pass filters to the F090W, F115W, F150W, and F200W images (see Diego et al. 2026a, for details), then combining the four filtered images into a single one. Many GCs can be seen in the image with an almost uniform number density. The yellow and cyan solid lines are the light contours in the raw F356W image at 50% and 25%, respectively, of the maximum intensity in the center. The yellow and cyan dashed curves are ellipses fitting the corresponding solid lines. The small yellow and cyan circles near the bright central source are the corresponding centers of the two ellipses. The bright source near the center is at the position of the peak emission in the raw images and it is likely the central SMBH. |
| In the text | |
Current usage metrics show cumulative count of Article Views (full-text article views including HTML views, PDF and ePub downloads, according to the available data) and Abstracts Views on Vision4Press platform.
Data correspond to usage on the plateform after 2015. The current usage metrics is available 48-96 hours after online publication and is updated daily on week days.
Initial download of the metrics may take a while.