


Fig. 1.
Download original image
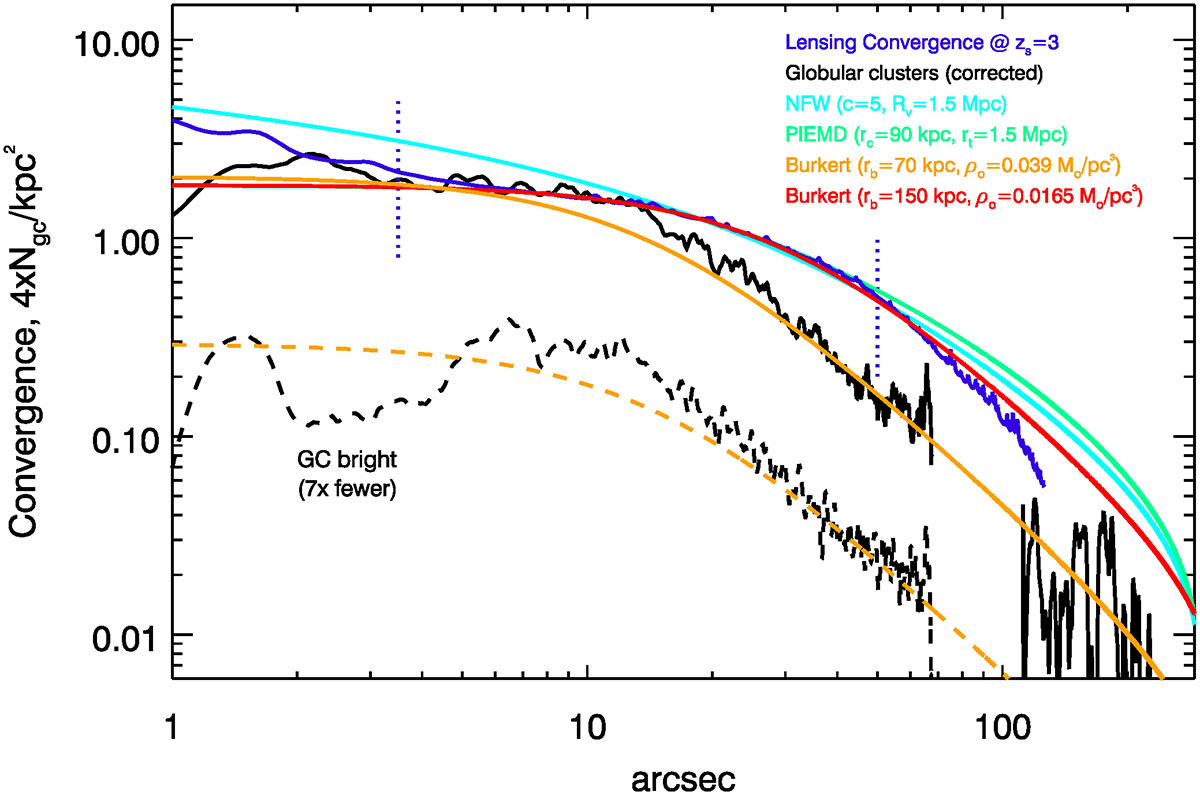
Comparison of the lensing mass and system of GC profiles with analytical models. The dark blue (lensing mass) and black (GCs) lines come from paper I and paper II, respectively. Between 1″ and 3″, the steeper profile in the lensing mass is due to the BCG that dominates the projected mass below 1″, or 4.921 kpc. Above this radius, the projected mass is dominated by DM (and with a small contribution from the X-ray emitting plasma). For the GC, the profile is corrected for background contamination. The solid black curve is rescaled by a factor of 4 to visually match the lensing profile. The light blue curve is an NFW profile that matches the lensing profile in the region constrained by lensing (blue vertical dotted lines). The green line is a PIEMD profile fitting the lensing mass from alternative lens models (see text). The red line is a Burkert profile fitting the lensing mass profile while the orange line is a different Burkert profile fitting the distribution of GCs. The dashed-black is the number density of the brightest GCs in the full sample obtained after increasing the detection threshold by one order of magnitude (and containing 4061 GCs, i.e., one-seventh the total number in the full catalog). The dashed black line includes the same factor of 4 as the black solid line. Finally, the dashed orange line is the same Burkert profile shown as a solid-orange line with rb = 70 kpc, but divided by a factor of 7.
Current usage metrics show cumulative count of Article Views (full-text article views including HTML views, PDF and ePub downloads, according to the available data) and Abstracts Views on Vision4Press platform.
Data correspond to usage on the plateform after 2015. The current usage metrics is available 48-96 hours after online publication and is updated daily on week days.
Initial download of the metrics may take a while.