


Fig. 2.
Download original image
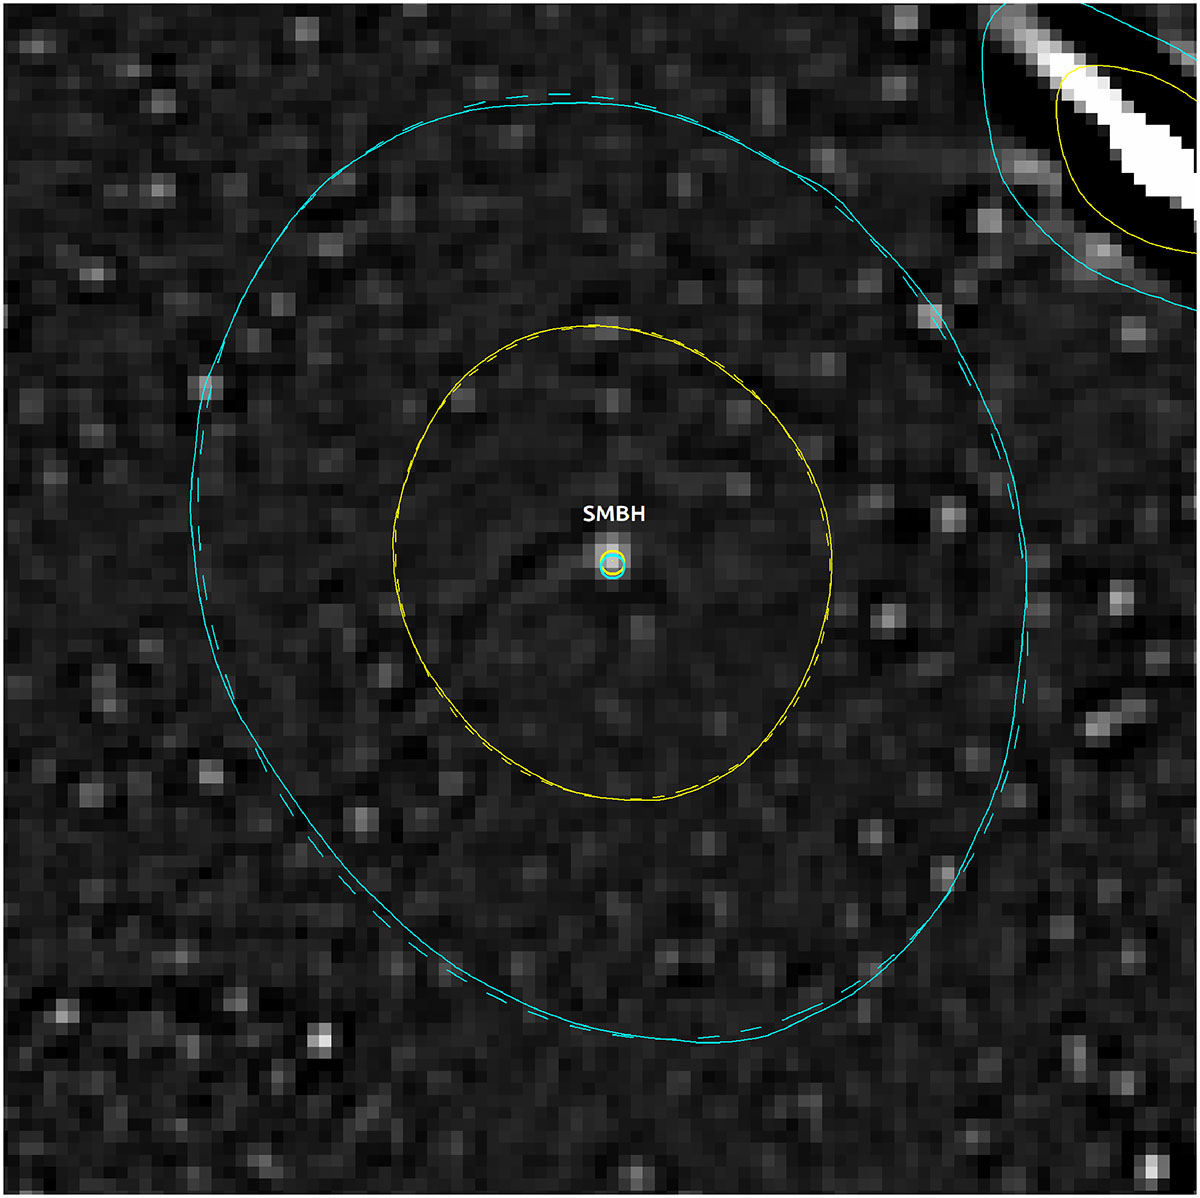
Central 3″ × 3″ region of AS1063 (filtered). The image is obtained after applying two high-pass filters to the F090W, F115W, F150W, and F200W images (see Diego et al. 2026a, for details), then combining the four filtered images into a single one. Many GCs can be seen in the image with an almost uniform number density. The yellow and cyan solid lines are the light contours in the raw F356W image at 50% and 25%, respectively, of the maximum intensity in the center. The yellow and cyan dashed curves are ellipses fitting the corresponding solid lines. The small yellow and cyan circles near the bright central source are the corresponding centers of the two ellipses. The bright source near the center is at the position of the peak emission in the raw images and it is likely the central SMBH.
Current usage metrics show cumulative count of Article Views (full-text article views including HTML views, PDF and ePub downloads, according to the available data) and Abstracts Views on Vision4Press platform.
Data correspond to usage on the plateform after 2015. The current usage metrics is available 48-96 hours after online publication and is updated daily on week days.
Initial download of the metrics may take a while.