


| Issue |
A&A
Volume 711, July 2026
|
|
|---|---|---|
| Article Number | A195 | |
| Number of page(s) | 10 | |
| Section | Extragalactic astronomy | |
| DOI | https://doi.org/10.1051/0004-6361/202659123 | |
| Published online | 14 July 2026 | |
The dual effect of group-scale environments on galaxy quenching during cluster infall: Pre-processing and protection
School of Physics and Astronomy, Beijing Normal University, Beijing, 100875, PR China
★ Corresponding author: This email address is being protected from spambots. You need JavaScript enabled to view it.
Received:
26
January
2026
Accepted:
20
May
2026
Abstract
Context. It is well established that the cluster environment effectively quenches star formation in member galaxies.
Aims. We aim to explore how the accretion path of infalling galaxies influences the cluster-driven quenching process.
Methods. We compiled a large spectroscopic galaxy sample around 25 low-redshift, X-ray luminous massive clusters. We identified cluster substructures using the Blooming Tree algorithm and distinguished between galaxies accreted as part of group-scale structures and those accreted in isolation. We quantified the infall process using an infall proxy, dR, defined in the R–V diagram, where R is the normalized projected clustercentric radius and V is the normalized line-of-sight (LOS) velocity relative to the cluster center.
Results. During the infall process, the quiescent fraction remains approximately constant at the outskirts and then increases steadily toward the cluster center, with a transition occurring around dR ∼ 2.5. We find that group-associated galaxies follow a distinct quenching track compared to isolated galaxies, indicating a dual effect of group-scale environments. At the early infall stages, group galaxies exhibit a higher quiescent fraction, consistent with “preprocessing” in group-scale halos. However, after entering the cluster environment, the increase in their quiescent fraction is shifted to smaller dR compared to isolated galaxies. This suggests a phenomenological “protection” effect, in which group-scale halos buffer member galaxies against rapid cluster-driven quenching.
Conclusions. We conclude that group-scale environments affect quenching in two ways: via preprocessing prior to cluster infall, and through a subsequent protection effect within the cluster environment.
Key words: galaxies: clusters: general / galaxies: evolution / galaxies: star formation
© The Authors 2026
 Open Access article, published by EDP Sciences, under the terms of the Creative Commons Attribution License (https://creativecommons.org/licenses/by/4.0), which permits unrestricted use, distribution, and reproduction in any medium, provided the original work is properly cited.
This article is published in open access under the Subscribe to Open model. This email address is being protected from spambots. You need JavaScript enabled to view it. to support open access publication.
1. Introduction
Galaxies in the Universe exhibit clear bimodal distributions in many physical properties, such as photometric colors, star formation rate (SFR), and morphology (e.g., Strateva et al. 2001; Bell et al. 2004; Peng et al. 2010; Schawinski et al. 2014). A central goal in galaxy evolution studies is to understand how star-forming galaxies are quenched to the quiescent population, and how this transition depends on both galaxy properties and the environment.
It is well known that quenching is driven by a combination of internal processes and external environmental effects (Peng et al. 2010; Cortese et al. 2021; De Lucia et al. 2025). Internal processes, primarily stellar and active galactic nucleus (AGN) feedback, can heat or expel cold gas and subsequently suppress star formation (e.g., Cicone et al. 2014; Wang & Peng 2023; Belli et al. 2024; Wang et al. 2025). These processes are closely related to the stellar and black hole masses of galaxies (Croton et al. 2006; Terrazas et al. 2020; Wang et al. 2024), producing more quiescent galaxies at the high-mass end. In addition, red and quiescent galaxy populations are more frequently found in dense environments, such as groups and clusters (Dressler 1980), where hydrodynamical interactions with the intracluster medium (ICM) and gravitational interactions with other galaxies regulate the gas supply (van den Bosch et al. 2008; von der Linden et al. 2010; Smith et al. 2012; Boselli & Gavazzi 2014; Wright et al. 2022). In less dense regions, such as groups and filaments, moderate gas stripping removes only the circumgalactic medium (CGM) of galaxies, thereby cutting off the replenishment of the cold gas reservoir. This process, known as starvation (or strangulation), ultimately leads to quenching over several gigayears (e.g., Larson et al. 1980; Balogh et al. 2000; Kawata & Mulchaey 2008; van de Voort et al. 2017; Trussler et al. 2020). In denser environments, such as the core regions of clusters, severe ram pressure stripping can directly remove the interstellar medium (ISM), resulting in very rapid quenching on timescales of ∼0.1 − 1 Gyr (Gunn et al. 1972; Yun et al. 2019; Roberts et al. 2019; Boselli et al. 2022; Rohr et al. 2023). Galaxy-galaxy interactions, including tidal stripping (Bournaud et al. 2004; Koopmann & Kenney 2004; Wang et al. 2022), harassment (Moore et al. 1996, 1998), and mergers (Spitzer & Baade 1951; Teyssier et al. 2010), can also strongly contribute to quenching.
Galaxy quenching in clusters is particularly complex because various mechanisms often operate simultaneously (De Lucia et al. 2025). Moreover, the diverse accretion histories of galaxies further complicate the quenching picture (Berrier et al. 2009; McGee et al. 2009; Smith et al. 2012). According to the standard cold dark matter (CDM) paradigm, large-scale cosmic structures form hierarchically, meaning that galaxies may traverse multiple environments before reaching present-day clusters (Zel’dovich 1970; Blumenthal et al. 1984; Davis et al. 1985; Colberg et al. 2005; Libeskind et al. 2018; Primack 2024). Some galaxies are initially accreted into lower-density structures (such as sheets, filaments, and groups), where “preprocessing” can already alter their gas content and star formation activity (e.g., Fujita 2004; McGee et al. 2009; Haines et al. 2013; Bahé et al. 2013; Kleiner et al. 2021; Piraino-Cerda et al. 2024; Lopes et al. 2024). These galaxies may subsequently enter the cluster as part of a bound system, potentially appearing as substructures in the cluster outskirts (Yu et al. 2015; Balestra et al. 2016; Yu et al. 2016, 2018). In contrast, other galaxies are accreted individually from the field and may remain relatively unaffected until they are directly exposed to the cluster environment (Berrier et al. 2009). Despite extensive work on average quenching trends in clusters, the dependence of quenching on the accretion path (e.g., group versus isolated infall) remains less constrained observationally. Furthermore, it is unclear whether group-scale environments continue to influence galaxies after they enter clusters.
Tracing the infall stage of observed galaxies offers a natural way to address this question. While simulations provide full 6D kinematics and orbital histories of galaxies (e.g., Oman et al. 2013), observations are limited to projected clustercentric distances and line-of-sight (LOS) peculiar velocities. This observable kinematic parameter space is called the R–V diagram1, where R represents the normalized projected clustercentric radius and V denotes the normalized LOS velocity relative to the cluster center. The R–V diagram has been widely used to statistically infer infall times based on calibration from simulations (e.g. Oman et al. 2013; Oman & Hudson 2016; Rhee et al. 2017; Pasquali et al. 2019; Dou & Yu 2025). Such approaches have revealed systematic evolutionary trends along the infall path for observed cluster galaxies (e.g. Noble et al. 2013, 2016; Sampaio et al. 2021; Qu et al. 2023; Kim et al. 2023; Brambila et al. 2023; Oxland et al. 2024; Sampaio et al. 2024). In this paper, we combine the infall process quantified in the R–V diagram with substructure identification to investigate how group-scale environments modulate galaxy quenching during cluster infall.
This paper is organized as follows. Section 2 presents the data sets used in this work. Section 3 details the methods used to quantify the infall stage in the R–V diagram and to identify substructures within clusters. Section 4 reports the results on galaxy quenching across different environments. We discuss the implications in Section 5 and summarize our conclusions in Section 6. Throughout this paper, we use the term “quiescent” to describe the star formation state of galaxies and “quenching” to denote the evolutionary process, although the two concepts are often used interchangeably in the literature.
2. Data
2.1. Cluster sample
We selected the cluster sample from the Meta-Catalog of X-Ray Detected Clusters of Galaxies (MCXC; Piffaretti et al. 2011), which is compiled from seven ROSAT (ROentgen SATellite) all-sky survey-based and five serendipitous cluster catalogs and provides essential cluster properties, including redshift, coordinates, standardized 0.1 − 2.4 keV band luminosity LX, 500, and R500 (the radius within which the mean enclosed density is 500 times the critical density of the Universe at the cluster redshift). We converted R500 to R200 using R200 = R500/0.65, assuming an NFW (Navarro–Frenk–White) profile with a concentration parameter of c = 4 (Reiprich et al. 2013). While assuming a fixed concentration (c = 4) formally introduces some uncertainty into the derived R200, the practical impact is negligible. Observationally, the concentration parameter exhibits a natural scatter (typically c ∼ 2 − 8) and is also affected by cluster triaxiality (Merten et al. 2015). However, the spatial conversion factor between overdensities is insensitive to the exact concentration. Specifically, the ratio R500/R200 varies only from approximately 0.61 (for c = 2) to 0.68 (for c = 8). This translates to a minimal systematic variance of ≲5% in R200. Therefore, adopting a fixed c = 4 is highly robust for our phase-space analysis.
We selected clusters within a narrow redshift range of 0.03 ≤ z ≤ 0.1 to minimize the impact of redshift evolution across the sample. We applied an X-ray luminosity threshold of LX, 500 > 1044 erg/s to focus on massive clusters with well-established X-ray cores.
This initial selection yielded 140 clusters, and all are more massive than 1014 M⊙.
2.2. Galaxy sample
We selected the galaxy sample from the Sloan Digital Sky Survey 18th data release (SDSS-DR18; Almeida et al. 2023), the first release of SDSS-V (Kollmeier et al. 2019). We first selected galaxies projected within a 5R200 radius around the cluster centers and with spectroscopic redshifts satisfying |z − zcl|≤0.03, where zcl is the cluster redshift. These criteria provide a sufficient volume to identify surrounding structures and include field galaxies that are not influenced by the cluster environment. We adopted the cluster-center coordinates and redshifts from the MCXC.
We took the star formation rates (SFRs) and stellar masses (M★) of galaxies from the second version of the GALEX-SDSS-WISE Legacy Catalog (GSWLC-2, Salim et al. 2016, 2018), which provides physical properties for ∼700 000 galaxies at z < 0.3 derived from spectral energy distribution (SED) fitting to UV, optical, and mid-IR photometry.
To ensure sufficient galaxies for robust analysis, we required at least 30 galaxies within R200 and within |z − zcl|≤0.01 for each cluster. We denote this number by Ncore in Table 1, which also lists the total number of galaxies (Ntot) and the number of galaxies with both SFR and M★ measurements (Ndata). The Ncore criterion is used solely as a preliminary quality-control step to ensure a sufficient data density for each cluster. The actual physical membership classification is strictly determined later in Section 3.2.
Basic information on the clusters sample.
In addition, we manually excluded obvious major mergers, including Abell 1650, Abell 2029, and Abell 2033, by visually inspecting their X-ray morphologies. The final sample contains 25 clusters and 12 498 unique galaxies, of which 11 122 have SFR and M★ measurements.
2.3. Stellar mass completeness limit
The SDSS spectroscopic galaxy sample is magnitude-limited at r = 17.77 (Strauss et al. 2002). However, the stellar-mass completeness limit depends on both the redshift and the mass-to-light ratio (M/L). We estimated the mass completeness limit using the empirical method of Pozzetti et al. (2010).
For each galaxy, we defined the limiting stellar mass as the mass it would have if its apparent magnitude were equal to the survey limit, rlim = 17.77:
 (1)
(1)
where Mreal and rreal are the observed stellar mass and r-band apparent magnitude, respectively. The distribution of Mlim therefore reflects the distribution of galaxy M/L. We show the real and limiting stellar masses as gray and black dots in the upper panel of Figure 1.
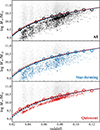 |
Fig. 1. Stellar mass as a function of redshift. Top panel: Observed stellar masses (gray dots) and corresponding limiting masses (black dots) of all galaxies. Middle and bottom panels: Same relations for star-forming (blue) and quiescent (red) galaxies, respectively. Open circles mark the 95th percentiles of the limiting-mass distributions in redshift bins of width Δz = 0.01. Solid curves show the best-fit completeness relations for the corresponding subsamples, while dashed curves show the fits for the other subsamples. We adopt the quiescent-galaxy fit (red curve) as the stellar-mass completeness limit for the full sample. |
We divided the sample into redshift bins of width 0.01. In each bin, we computed the 95th percentile of Mlim and adopted it as the 95% completeness limit. We fit these limits with a logarithmic function of redshift. We also performed the fit separately for star-forming (log10sSFR/yr−1 > −11; see Section 2.4) and quiescent galaxies, as shown in the middle and lower panels of Figure 1 The best-fitting completeness relations are shown as dashed curves in all panels and as solid lines in their corresponding panels. The three curves are close to each other, with the quiescent-galaxy curve lying slightly above the other two.
We therefore adopted the quiescent-galaxy fit (red curve) as the stellar-mass completeness limit for the full sample:
 (2)
(2)
We defined galaxies above the red curve as the mass-complete sample. Because few galaxies in the mass-complete sample have masses lower than 109.5 M⊙, we adopted 109.5 M⊙ as a mass cut to ensure robust statistics. Finally, the mass-complete sample contains 7092 galaxies (2654 star-forming and 4438 quiescent), which we use in the analysis in Section 4.
2.4. Classification of star-forming and quiescent galaxies
Galaxies exhibit a bimodal distribution in the logSFR versus log M★ plane. As shown in panel (a) of Figure 2, galaxies with relatively high SFRs follow the tight and nearly linear star-forming main sequence (SFMS, e.g., Salim et al. 2007). A distinct population of quiescent galaxies with significantly lower SFRs is also evident, particularly at the high-mass end. Panel (c) of Figure 2. shows the distribution of specific star formation rate (sSFR), defined as logsSFR = logSFR − log M★ as a function of stellar mass. To separate star-forming and quiescent galaxies, we adopted a commonly used threshold of log10sSFR/yr−1 = −11 (e.g., Brinchmann et al. 2004; Franx et al. 2008; Fontanot et al. 2009; McGee et al. 2011; Ilbert et al. 2013; Sherman et al. 2020; Donnari et al. 2021).
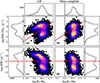 |
Fig. 2. Star formation activity as a function of stellar mass for the full sample (left column) and the mass-complete sample (right column). Panels (a) and (b): logSFR versus log(M★/M⊙), while panels (c) and (d) show logsSFR versus log M★/M⊙. Red lines indicate the adopted threshold of log10sSFR/yr−1 = −11 for separating star-forming and quiescent galaxies. The solid black lines mark the stellar-mass cut of log M★/M⊙ = 9.5. Marginal histograms show the corresponding one-dimensional distributions. |
Panels (b) and (d) of Figure 2 show the SFR and sSFR distributions of the mass-complete sample, respectively. The mass-complete selection preferentially removes low-mass star-forming galaxies, since they generally have higher M/L than quiescent galaxies. We note that although a slightly lower threshold (e.g. log10sSFR/yr−1 ≈ −11.2) might be closer to the saddle point of the sSFR distribution, according to panel (d) and the corresponding histogram, we adopted the threshold more commonly used log10sSFR/yr−1 = −11 to facilitate direct comparisons with previous studies.
3. Methods
3.1. Tracing the infall process in the R–V diagram
To explore the galaxy quenching process as a function of infall stage, we used a statistical infall proxy provided by Dou & Yu (2025), which uses a series of parallel lines to trace the infall process in the R–V diagram. Using the TNG300 simulation, Dou & Yu (2025) demonstrate that this linear proxy provides a more accurate correspondence with infall time than previous methods. Figure 3 shows examples of these parallel lines.
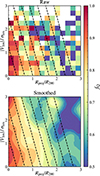 |
Fig. 3. Quiescent fraction fQ in the R–V diagram. Top: Raw, binned distribution in the R–V diagram. Bins containing fewer than five galaxies are left blank (white). Bottom: Same distribution after smoothing. Dashed lines show the parallel lines (slope k = −3.7, Dou & Yu 2025) used to define the infall proxy dR. |
For each galaxy, a corresponding line passes through its location. Dou & Yu (2025) originally used the perpendicular distance from the origin to the line,  , to quantify the infall process. Here we instead use the x-intercept of the line:
 (3)
(3)
where k = −3.7 is the slope of the line, R = Rproj/R200 is the projected clustercentric radius normalized by R200, and V = |ΔVlos|/σ is the line-of-sight velocity offset from the cluster center normalized by the cluster velocity dispersion. We estimated the velocity dispersion using the caustic method (Diaferio & Geller 1997; Diaferio 1999; Serra et al. 2011). With this definition, smaller dR corresponds to earlier infall, and dR is convenient to compare trends along the infall stage and those as a function of the projected radius.
Figure 3 shows the distribution of the quiescent fraction (fQ) in the R–V diagram. The top panel presents the raw binned map, and the bottom panel shows the same distribution smoothed using an Epanechnikov kernel with a size of 0.5. The parallel lines from Dou & Yu (2025) broadly follow the contours of fQ, supporting the use of dR as a practical proxy for tracing evolutionary trends during cluster infall.
3.2. Structure identification
Cluster galaxies may have experienced multiple environments before accretion, implying diverse infall pathways. To investigate the impact of such pathways, we classified galaxies according to their local environments.
We adopted the Blooming Tree (BT) algorithm (Yu et al. 2018; Yu & Diaferio 2025) to identify structures around each cluster. This algorithm arranges all galaxies in the field of view into a dendrogram, based on the pairwise projected binding energy, which is estimated from the location of the galaxies on the sky and their redshift (Diaferio 1999; Yu et al. 2015, 2016). The dendrogram is subsequently trimmed into distinct structures using a density contrast parameter Δη, which quantifies the degree to which a structure is overdense relative to the background. The η parameter reflects the compactness of a structure, taking into account its size, number of member galaxies, and line-of-sight velocity dispersion. Larger density contrast Δη selects increasingly dense and gravitationally bound structures. The specific choice of Δη also depends on the sampling density. For SDSS, the BT algorithm identifies superclusters with Δη = 1, clusters with Δη = 20, and dense core of clusters with Δη = 50 (Yu & Diaferio 2025).
We adopted Δη = 20 to identify all structures in the field of view. We classified galaxies belonging to the most central structure of each cluster as core members and hereafter refer to them as “cluster galaxies”. They are dominated by the main dark halo of the cluster. We defined galaxies residing in other identified structures as “group galaxies”. These systems are dominated by local group-scale halos, including both infalling groups surrounding the clusters and substructures within the clusters. We classified galaxies not associated with any identified structure as “isolated galaxies”, including those close to the cluster but infalling individually, as well as real field galaxies with no physical association with the cluster.
Applying this classification to the 7092 mass-complete galaxies yielded 1405 cluster galaxies, 1737 group galaxies, and 3950 isolated galaxies. We used all 12 498 galaxies with spectroscopic redshifts for structure identification, and only the mass-complete sample for the subsequent analysis.
Figure 4 shows the distributions of the three populations in the R–V diagram. Cluster galaxies preferentially occupy the virialized region, whereas group and isolated galaxies are more common at larger radii and higher velocity. However, a small number of cluster galaxies extend to large radii but have small velocities. We attribute this to structure misclassification and discuss this further in Section 5.5.
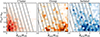 |
Fig. 4. Distribution in the R–V diagram for cluster galaxies (red), group galaxies (orange), and isolated galaxies (blue), respectively. Colors indicate the number densities. The dashed lines show the parallel lines of Dou & Yu (2025). |
4. Results
In the subsequent analysis, we computed the quiescent fraction (fQ) within a specific parameter bin as the raw ratio of the number of quiescent galaxies to the total number of galaxies. We estimated uncertainties in fQ using the Wilson score interval (Wilson 1927; Astropy Collaboration 2018) for a binomial proportion. In each figure, shaded regions denote the corresponding 1σ (68%) confidence limits.
4.1. Quenching of all galaxies
Since both internal and external processes can quench galaxies, we examine both by plotting the quiescent fraction fQ as a function of stellar mass and the infall proxy dR in the bottom left panel of Figure 5, with the corresponding one-dimensional trends shown in the top and right panels, and uncertainties indicated by the gray squares. As expected, fQ increases with stellar mass: galaxies are more likely to be quiescent at higher M★, consistent with stronger internal feedback in more massive systems. Similar results have been reported in many previous works (e.g., Kauffmann et al. 2004; Peng et al. 2010; Taylor et al. 2023; Shi et al. 2024), and the most massive galaxies (log M★ > 1011.5M⊙) are nearly all quiescent, even in the field.
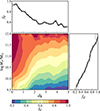 |
Fig. 5. Quiescent fraction fQ as a function of stellar mass and the infall proxy dR for the full galaxy sample. The bottom-left panel shows fQ in the log M★/M⊙ − dR plane with colors indicating fQ. The top and right panels show the corresponding one-dimensional trends of fQ as a function of dR and log M★/M⊙, respectively. The bin sizes are 0.25 in both ΔdR and Δlog M★/M⊙. The fQ values in each bin are indicated by solid horizontal lines and the shaded squares show the 68% Wilson binomial confidence intervals for fQ. |
The quiescent fraction shows a two-stage behavior along the infall process. At early infall stages (dR ≳ 2.5), the quiescent fraction remains nearly constant. Once galaxies reach dR ≈ 2.5, fQ increases steadily up to nearly 100% toward the cluster center. This behavior suggests a characteristic cluster boundary, inside which environmental effects become increasingly important for quenching.
4.2. Quenching in three different local environments
Here we examine quenching in cluster, group, and isolated galaxies separately. The overall quiescent fractions of cluster, group, and isolated galaxies are 80%, 65%, and 55%, respectively, consistent with more efficient quenching in denser environments. Figure 6 shows the quiescent fraction as a function of stellar mass and the infall proxy dR for cluster, group, and isolated galaxies.
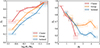 |
Fig. 6. Quiescent fraction fQ for galaxies in three local environments as a function of stellar mass (left) and the infall proxy dR (right). The bin sizes are Δlog M★/M⊙ = 0.5 and ΔdR = 0.6, respectively. Cluster, group, and isolated galaxies are shown as red, orange, and blue curves, respectively. Shaded squares indicate the uncertainties in fQ. |
In the fQ–M★ relation, group galaxies exhibit a systematically higher quiescent fraction (by roughly 10%) than isolated galaxies across the entire mass range, and the two curves show remarkably similar slopes. This nearly constant offset suggests that the additional quenching driven by the group-scale environment has a broadly comparable efficiency across the stellar masses probed here. In contrast, cluster galaxies show a different mass dependence. They have quiescent fractions similar to those of group galaxies at the high-mass end (log M★/M⊙ > 11), but display significantly higher quiescent fractions at the low-mass end, where fQ reaches approximately 50% at log M★/M⊙ = 9.75, compared to fQ ≈ 30% for group galaxies. Such a mass dependence is consistent with more efficient cluster-driven quenching (e.g., ram pressure stripping) for lower-mass galaxies, which have shallow potentials. At the high-mass end, galaxies are less sensitive to the environment and are often quenched primarily by internal processes.
Turning to the fQ–dR relation, all three samples broadly follow the overall trend in Figure 5, showing an outer plateau followed by a rise toward smaller dR. The cluster sample is an exception, with fQ increasing steadily from ∼50% at dR ≈ 2 to > 90% toward the center. Because cluster galaxies are mainly concentrated at dR < 2, the number of cluster galaxies at larger dR is small and the outer trend is therefore less well constrained. A notable feature is the difference between group and isolated galaxies. Both show an outer plateau, but at different levels (approximately 65% and 50%, respectively), suggesting preprocessing in group-scale halos prior to cluster infall.
More importantly, the transition points of group and isolated galaxies differ: fQ for isolated galaxies begins to rise at dR ≈ 2.5, whereas the group sample remains flat until dR ≲ 2, indicating a delayed quenching of group galaxies. Additional evidence of this delay lies in the overall trends: although isolated galaxies exhibit a quiescent fraction ∼15% lower than group galaxies at dR > 3, they catch up and converge with group galaxies within dR = 2, suggesting a higher quenching efficiency in isolated galaxies than in group galaxies.
At dR < 2, all three populations exhibit indistinguishable quiescent fractions within uncertainty, indicating that the overwhelming cluster environment completely dominates galaxy quenching and washes out the initial differences imprinted by the local group-scale environments.
4.3. The influence of mass on the quenching process
To further investigate how stellar mass and environment jointly influence quenching during infall, we subdivided each of the three environmental samples into three stellar-mass bins: low-mass galaxies with 9.5 ≤ log M★/M⊙ < 10.5, intermediate-mass galaxies with 10.5 ≤ log M★/M⊙ < 11, and high-mass galaxies with log M★/M⊙ ≥ 11. Figure 7 shows the resulting fQ–dR relations.
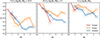 |
Fig. 7. Quiescent fraction fQ as a function of the infall proxy dR for galaxies across different local environments and stellar-mass bins. The bin size is ΔdR = 0.6. |
Overall, more massive galaxies exhibit systematically higher fQ across all environments, consistent with the trends shown in Figures 5 and 6. At fixed mass, the signatures of preprocessing and the delayed quenching of group galaxies observed in Section 4 remain visible, although their amplitudes vary with stellar mass.
The high-mass galaxies show mutually consistent trends within uncertainties, suggesting that internal rather than environmental quenching dominates at log(M★/M⊙)≥11. In contrast, for lower-mass galaxies, both preprocessing and delayed quenching of group galaxies are significantly more pronounced. In the low-mass sample, the fQ offset between the group and isolated galaxies reaches > 20% at dR > 3, but fully converges at dR < 2.5. The intermediate-mass galaxies exhibit transitional behavior that bridges the low- and high-mass cases.
5. Discussion
5.1. Physical meaning of dR
Throughout this paper, we use dR as a proxy to trace the infall process. However, dR does not provide a one-to-one mapping to the true infall time. Dou & Yu (2025) demonstrate that infall times inferred from the R–V diagram exhibit substantial intrinsic dispersion due to orbital overlap and projection effects. As a result, although a given dR value is associated with a characteristic infall stage, it actually corresponds to a broad distribution of infall times. The evolutionary trends reported as a function of dR should therefore be interpreted as population-averaged behavior, tracing the gradual transition from the unperturbed cosmic field to the dense cluster environment, rather than as the evolution of individual galaxies along a single, well-defined timeline.
5.2. The “delay-then-rapid” scenario
As shown in Section 4, the variation in the quiescent fraction along dR exhibits two phenomenological stages: a plateau at the beginning of infall and steady quenching after a transition point. This behavior is broadly consistent with the well-known “delay-then-rapid” quenching scenario (Wetzel et al. 2013; Haines et al. 2013). In this framework, galaxies are not quenched immediately upon their first infall into a host halo. Instead, they maintain roughly constant star formation for ∼2 − 4 Gyr, a phase during which “starvation” (i.e., the shutoff of gas replenishment) is thought to dominate. After this delay phase, galaxies undergo rapid quenching on a timescale of ≲1 Gyr, as more efficient mechanisms such as ram pressure stripping become important.
Although the original delay-then-rapid scenario was formulated with respect to a galaxy’s first infall into any host halo (often during the group stage), rather than the infall into the current (final) cluster halo considered here, our results can be interpreted within a similar physical framework. At large dR (≳ 2.5), corresponding to the early stage of cluster infall, the ICM is relatively diffuse and is more likely to primarily affect the extended gas reservoir (i.e., the CGM) of galaxies, leading to starvation. As galaxies move to smaller dR (≲ 2.5), they encounter denser regions where ram pressure stripping becomes increasingly effective, driving fQ upward toward the cluster center.
5.3. The dual role of group-scale environments
It has long been recognized that galaxies in clusters are influenced not only by their current cluster environment, but also by the environments they experienced throughout their histories. In particular, galaxies residing in group-scale halos often show suppressed star formation relative to field galaxies, even before reaching the densest regions of clusters. This preprocessing has been extensively studied (Fujita 2004; Vijayaraghavan & Ricker 2013; Kleiner et al. 2021; Piraino-Cerda et al. 2024; Lopes et al. 2024).
Our analysis reveals an additional distinct effect associated with group environments. As demonstrated in Figure 6, group galaxies exhibit delayed quenching compared to isolated galaxies. This suggests that group galaxies are less rapidly affected than isolated galaxies upon entering the cluster. This behavior can be phenomenologically described as a “protection” effect of group environments. Moreover, we find that this protection effect depends on the stellar mass and appears stronger at lower stellar masses. This is consistent with the scenario in which massive galaxies are primarily quenched by internal processes, whereas low-mass galaxies are more sensitive to environmental mechanisms.
The dual roles of preprocessing and protection are fundamentally compatible. Compared to the field, the denser group environment enhances quenching, thus increasing the baseline fQ prior to infall. However, in a harsh cluster environment, group-scale halos may serve as a buffer that reduces the immediate impact of cluster-related processes on their member galaxies. In contrast, isolated galaxies are directly exposed to the ICM and the cluster potential immediately upon infall.
A similar effect has been explored in The Three Hundred simulation. Kotecha et al. (2022) report that within the hot dense cluster environment, galaxies closer to intracluster filaments exhibit delayed quenching compared to those outside filaments. The underlying physical mechanisms are complex. Kotecha et al. (2022) examined the gas flow and find that streams of cold gas moving coherently with galaxies can effectively decrease the local ram pressure toward the centers of filaments, thereby shielding galaxies from gas stripping. Furthermore, this gas can be accreted onto galaxies, serving as fuel for sustained star formation. Given that galaxy groups generally infall into clusters along filaments, the protection effect observed in our group galaxies may be physically associated with filaments. Moreover, Kotecha et al. (2022) also note that within clusters, more massive halos retain a higher fraction of cold gas, whereas smaller halos are more susceptible to the cluster environment. Consequently, the deeper potential wells of group-scale halos may also help them retain cold gas more effectively than isolated galaxies.
5.4. Independent evidence from stellar ages
Quenching mechanisms behind preprocessing, such as starvation, typically require a substantial timescale to suppress the SFR sufficiently to visibly alter the quiescent fraction, fQ. Therefore, the elevated fQ observed in group galaxies at early infall stages (dR > 3) strongly implies that these galaxies have already experienced prolonged preprocessing within their local group halos prior to cluster accretion. To provide independent spectroscopic evidence for this long-term evolutionary divergence, we examined the distribution of the Dn4000 index across different dR, as shown in Figure 8. As a robust proxy for the mean stellar age, the Dn4000 index integrates the star-formation history over timescales of ∼1 − 2 Gyr (e.g., Kauffmann et al. 2004), allowing us to track the cumulative effect of environments. We also performed Kolmogorov-Smirnov (KS) tests to quantify the statistical significance of the differences between these distributions, with the corresponding p-values indicated in the figure.
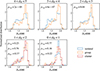 |
Fig. 8. Distributions of the Dn4000 index for cluster (red), group (orange), and isolated (blue) galaxies across different dR intervals. The p-values derived from two-sample Kolmogorov-Smirnov (KS) tests comparing these populations are provided in the upper left corner of each panel. The subscripts i, g, and c denote the isolated, group, and cluster galaxies, respectively. |
At the early infall stages (dR > 3), group galaxies exhibit a systematic shift toward larger Dn4000 values compared to isolated galaxies, with extremely small p-values indicating a significant difference between these two populations. This contrast suggests older stellar populations of group galaxies and provides independent spectroscopic evidence for preprocessing. Furthermore, as galaxies move toward the cluster center (smaller dR), the Dn4000 distributions of all three populations gradually converge. Within dR < 2, the distributions become virtually indistinguishable (p-values > 0.05), with the majority of galaxies reaching high Dn4000 values. This evolutionary convergence mirrors the behavior seen in the fQ–dR relation (Figure 6) and reinforces the conclusion that the dominant cluster-driven mechanisms (e.g., ram pressure stripping) ultimately govern the quenching process, effectively washing out the initial differences imprinted by their pre-cluster accretion histories.
5.5. Contamination from interlopers and backsplash galaxies
In the R–V diagram, contamination from interlopers is physically unavoidable because of projection effects, especially at R ≳ 2 (Oman & Hudson 2016; Dou & Yu 2025). Interlopers are foreground or background galaxies that have no physical association with the target cluster. However, our methodology effectively mitigates this contamination. Because our algorithm identifies groups and clusters based on robust binding energy and local overdensities, dynamically unbound interlopers typically fail to meet the membership criteria for these dense structures. Consequently, the vast majority of them are assigned to the isolated sample, preserving the purity of the group and core cluster populations. The only notable exception occurs at dR ≈ 2 for cluster galaxies. At this large clustercentric distance, true cluster members become intrinsically sparse, and this specific radial bin in the cluster sample may be dominated by interlopers, leading to the low fQ shown in Figure 5.
Furthermore, it is crucial to recognize the diluting impact of any residual contamination. The quiescent fraction of group galaxies will be lower than the true value if they are contaminated by interlopers, thus reducing the observed offset between group and isolated galaxies. Therefore, our conclusions regarding preprocessing and protection can be considered conservative lower limits and remain qualitatively robust.
Backsplash galaxies are those that have passed through the cluster core at least once and have rebounded to the outskirts (typically out to the splashback radius of Rsp ≲ 2R200 More et al. 2015, 2016). Even if they infall initially as part of a group, their structures are largely disrupted by severe tidal stripping during their pericentric passages. Thus, the BT algorithm classifies most of them as cluster galaxies (the core structure) because they lie close to the center and lack local binding. While some residuals that travel to large distances are classified as isolated galaxies, this leads to an overestimated quiescent fraction.
6. Summary
In this paper, we investigate galaxy quenching during cluster infall and assess how local group-scale environments modulate this process. We used a sample of 25 low-redshift, X-ray luminous, massive clusters selected from the MCXC, combined with a mass-complete galaxy sample covering 5R200 around the clusters.
To trace the infall stage, we adopted the infall proxy dR, defined by a series of parallel lines in the R–V diagram. We emphasize that dR serves as a phenomenological metric tracing the macroscopic infall process rather than as an accurate clock. To distinguish local environments, we applied the Blooming Tree algorithm to identify substructures based on the projected binding energy and classified galaxies into three populations: cluster galaxies (members of the core structure), group galaxies (members of other structures), and isolated galaxies (not assigned to any structure). This physical binding requirement effectively mitigates the contamination from purely projected interlopers.
The quiescent fraction generally exhibits a clear two-stage behavior as a function of dR. It remains approximately constant at dR ≳ 2.5 and then increases steadily toward smaller dR, approaching unity near the cluster centers. Phenomenologically, this is consistent with the delay-then-rapid scenario in which relatively gentle processes operate during the early infall stages, while more efficient environmental mechanisms become increasingly dominant at smaller dR.
Furthermore, our results reveal that group-scale environments play a dual role in quenching. At large dR, group galaxies show a higher quiescent fraction than isolated galaxies, consistent with preprocessing in group-scale halos prior to cluster infall. In contrast, the rise of fQ toward smaller dR occurs later for group galaxies compared to isolated galaxies. We refer to this delay as a protection signature associated with group-scale environments, which may be attributed to the presence of cold gas in filaments. Finally, at dR < 2, the quiescent fractions of all three populations converge, indicating that the overwhelming cluster environment ultimately dominates galaxy quenching.
The new generation of wide-field surveys, such as DESI (Dark Energy Spectroscopic Instrument) (Levi et al. 2013; DESI Collaboration 2016) and Euclid (Laureijs et al. 2011; Euclid Collaboration: Mellier et al. 2025), will deliver significantly larger and deeper spectroscopic and photometric data sets with improved estimates of galaxy physical properties. These data will enable more stringent tests of how accretion histories and group-scale environments regulate quenching during cluster infall.
Acknowledgments
We sincerely thank the referee for the valuable comments and constructive suggestions, which helped refine our arguments and strengthen the presentation of our results. This work has been supported by the National Natural Science Foundation of China No. 12573003, the National Key Research and Development Program of China (No. 2023YFC2206704), and the China Manned Space Program with grant No. CMS-CSST-2025-A04. This work was made possible thanks to a number of open-source software packages: AstroPy (Astropy Collaboration 2018), Matplotib (Barrett et al. 2005), NumPy (van der Walt et al. 2011), Pandas (McKinney 2010) and SciPy (Gommers et al. 2024).
References
- Almeida, A., Anderson, S. F., Argudo-Fernández, M., & Badenes, C. 2023, ApJS, 267, 44 [NASA ADS] [CrossRef] [Google Scholar]
- Astropy Collaboration (Price-Whelan, A. M., et al.) 2018, AJ, 156, 123 [Google Scholar]
- Bahé, Y. M., McCarthy, I. G., Balogh, M. L., & Font, A. S. 2013, MNRAS, 430, 3017 [Google Scholar]
- Balestra, I., Mercurio, A., Sartoris, B., et al. 2016, ApJS, 224, 33 [Google Scholar]
- Balogh, M. L., Navarro, J. F., & Morris, S. L. 2000, ApJ, 540, 113 [Google Scholar]
- Barrett, P., Hunter, J., Miller, J. T., Hsu, J. C., & Greenfield, P. 2005, ASP Conf. Ser., 347, 91 [Google Scholar]
- Bell, E. F., Wolf, C., Meisenheimer, K., et al. 2004, ApJ, 608, 752 [NASA ADS] [CrossRef] [Google Scholar]
- Belli, S., Park, M., Davies, R. L., et al. 2024, Nature, 630, 54 [NASA ADS] [CrossRef] [Google Scholar]
- Berrier, J. C., Stewart, K. R., Bullock, J. S., et al. 2009, ApJ, 690, 1292 [NASA ADS] [CrossRef] [Google Scholar]
- Blumenthal, G. R., Faber, S. M., Primack, J. R., & Rees, M. J. 1984, Nature, 311, 517 [Google Scholar]
- Boselli, A., & Gavazzi, G. 2014, A&ARv, 22, 74 [Google Scholar]
- Boselli, A., Fossati, M., & Sun, M. 2022, A&ARv, 30, 3 [NASA ADS] [CrossRef] [Google Scholar]
- Bournaud, F., Duc, P. A., Amram, P., Combes, F., & Gach, J. L. 2004, A&A, 425, 813 [NASA ADS] [CrossRef] [EDP Sciences] [Google Scholar]
- Brambila, D., Lopes, P. A. A., Ribeiro, A. L. B., & Cortesi, A. 2023, MNRAS, 523, 785 [NASA ADS] [CrossRef] [Google Scholar]
- Brinchmann, J., Charlot, S., White, S. D. M., et al. 2004, MNRAS, 351, 1151 [Google Scholar]
- Cicone, C., Maiolino, R., Sturm, E., et al. 2014, A&A, 562, A21 [NASA ADS] [CrossRef] [EDP Sciences] [Google Scholar]
- Colberg, J. M., Krughoff, K. S., & Connolly, A. J. 2005, MNRAS, 359, 272 [NASA ADS] [CrossRef] [Google Scholar]
- Cortese, L., Catinella, B., & Smith, R. 2021, PASA, 38, e035 [NASA ADS] [CrossRef] [Google Scholar]
- Croton, D. J., Springel, V., White, S. D. M., et al. 2006, MNRAS, 365, 11 [Google Scholar]
- Davis, M., Efstathiou, G., Frenk, C. S., & White, S. D. M. 1985, ApJ, 292, 371 [Google Scholar]
- De Lucia, G., Fontanot, F., Hirschmann, M., & Xie, L. 2025, arXiv e-prints [arXiv:2502.01724] [Google Scholar]
- DESI Collaboration (Aghamousa, A., et al.) 2016, arXiv e-prints [arXiv:1611.00036] [Google Scholar]
- Diaferio, A. 1999, MNRAS, 309, 610 [CrossRef] [Google Scholar]
- Diaferio, A., & Geller, M. J. 1997, ApJ, 481, 633 [NASA ADS] [CrossRef] [Google Scholar]
- Donnari, M., Pillepich, A., Nelson, D., et al. 2021, MNRAS, 506, 4760 [NASA ADS] [CrossRef] [Google Scholar]
- Dou, H., & Yu, H. 2025, A&A, 699, A95 [NASA ADS] [CrossRef] [EDP Sciences] [Google Scholar]
- Dressler, A. 1980, ApJ, 236, 351 [Google Scholar]
- Euclid Collaboration (Mellier, Y., et al.) 2025, A&A, 697, A1 [Google Scholar]
- Fontanot, F., De Lucia, G., Monaco, P., Somerville, R. S., & Santini, P. 2009, MNRAS, 397, 1776 [NASA ADS] [CrossRef] [Google Scholar]
- Franx, M., van Dokkum, P. G., Förster Schreiber, N. M., et al. 2008, ApJ, 688, 770 [NASA ADS] [CrossRef] [Google Scholar]
- Fujita, Y. 2004, PASJ, 56, 29 [NASA ADS] [Google Scholar]
- Gommers, R., Virtanen, P., Haberland, M., et al. 2024, https://doi.org/10.5281/zenodo.10909890 [Google Scholar]
- Gunn, J. E., Gott, J., & Richard, I. 1972, ApJ, 176, 1 [Google Scholar]
- Haines, C. P., Pereira, M. J., Smith, G. P., et al. 2013, ApJ, 775, 126 [NASA ADS] [CrossRef] [Google Scholar]
- Ilbert, O., McCracken, H. J., Le Fèvre, O., et al. 2013, A&A, 556, A55 [NASA ADS] [CrossRef] [EDP Sciences] [Google Scholar]
- Kauffmann, G., White, S. D. M., Heckman, T. M., et al. 2004, MNRAS, 353, 713 [Google Scholar]
- Kawata, D., & Mulchaey, J. S. 2008, ApJ, 672, L103 [NASA ADS] [CrossRef] [Google Scholar]
- Kim, K. J., Bayliss, M. B., Noble, A. G., et al. 2023, ApJ, 955, 32 [CrossRef] [Google Scholar]
- Kleiner, D., Serra, P., Maccagni, F. M., et al. 2021, A&A, 648, A32 [NASA ADS] [CrossRef] [EDP Sciences] [Google Scholar]
- Kollmeier, J., Anderson, S. F., Blanc, G. A., et al. 2019, BAAS, 51, 274 [NASA ADS] [Google Scholar]
- Koopmann, R. A., & Kenney, J. D. P. 2004, ApJ, 613, 866 [Google Scholar]
- Kotecha, S., Welker, C., Zhou, Z., et al. 2022, MNRAS, 512, 926 [NASA ADS] [CrossRef] [Google Scholar]
- Larson, R. B., Tinsley, B. M., & Caldwell, C. N. 1980, ApJ, 237, 692 [Google Scholar]
- Laureijs, R., Amiaux, J., Arduini, S., et al. 2011, arXiv e-prints [arXiv:1110.3193] [Google Scholar]
- Levi, M., Bebek, C., Beers, T., et al. 2013, arXiv e-prints [arXiv:1308.0847] [Google Scholar]
- Libeskind, N. I., van de Weygaert, R., Cautun, M., et al. 2018, MNRAS, 473, 1195 [NASA ADS] [CrossRef] [Google Scholar]
- Lopes, P. A. A., Ribeiro, A. L. B., & Brambila, D. 2024, MNRAS, 527, L19 [Google Scholar]
- McGee, S. L., Balogh, M. L., Bower, R. G., Font, A. S., & McCarthy, I. G. 2009, MNRAS, 400, 937 [Google Scholar]
- McGee, S. L., Balogh, M. L., Wilman, D. J., et al. 2011, MNRAS, 413, 996 [NASA ADS] [CrossRef] [Google Scholar]
- McKinney, W. 2010, in Proceedings of the 9th Python in Science Conference, eds. S. van der Walt, & J. Millman, 56 [Google Scholar]
- Merten, J., Meneghetti, M., Postman, M., et al. 2015, ApJ, 806, 4 [Google Scholar]
- Moore, B., Katz, N., Lake, G., Dressler, A., & Oemler, A. 1996, Nature, 379, 613 [Google Scholar]
- Moore, B., Lake, G., & Katz, N. 1998, ApJ, 495, 139 [Google Scholar]
- More, S., Diemer, B., & Kravtsov, A. V. 2015, ApJ, 810, 36 [Google Scholar]
- More, S., Miyatake, H., Takada, M., et al. 2016, ApJ, 825, 39 [NASA ADS] [CrossRef] [Google Scholar]
- Noble, A. G., Webb, T. M. A., Muzzin, A., et al. 2013, ApJ, 768, 118 [Google Scholar]
- Noble, A. G., Webb, T. M. A., Yee, H. K. C., et al. 2016, ApJ, 816, 48 [NASA ADS] [CrossRef] [Google Scholar]
- Oman, K. A., & Hudson, M. J. 2016, MNRAS, 463, 3083 [Google Scholar]
- Oman, K. A., Hudson, M. J., & Behroozi, P. S. 2013, MNRAS, 431, 2307 [Google Scholar]
- Oxland, M., Parker, L. C., de Carvalho, R. R., & Sampaio, V. M. 2024, MNRAS, 529, 3651 [NASA ADS] [CrossRef] [Google Scholar]
- Pasquali, A., Smith, R., Gallazzi, A., et al. 2019, MNRAS, 484, 1702 [Google Scholar]
- Peng, Y.-J., Lilly, S. J., Kovač, K., et al. 2010, ApJ, 721, 193 [Google Scholar]
- Piffaretti, R., Arnaud, M., Pratt, G. W., Pointecouteau, E., & Melin, J. B. 2011, A&A, 534, A109 [NASA ADS] [CrossRef] [EDP Sciences] [Google Scholar]
- Piraino-Cerda, F., Jaffé, Y. L., Lourenço, A. C., et al. 2024, MNRAS, 528, 919 [NASA ADS] [CrossRef] [Google Scholar]
- Pozzetti, L., Bolzonella, M., Zucca, E., et al. 2010, A&A, 523, A13 [NASA ADS] [CrossRef] [EDP Sciences] [Google Scholar]
- Primack, J. R. 2024, Ann. Rev. Nucl. Part. Sci., 74, 173 [Google Scholar]
- Qu, C.-G., Yu, H., Diaferio, A., Sohn, J., & Liu, D. 2023, Res. Astron. Astrophys., 23, 085007 [Google Scholar]
- Reiprich, T. H., Basu, K., Ettori, S., et al. 2013, Space Sci. Rev., 177, 195 [Google Scholar]
- Rhee, J., Smith, R., Choi, H., et al. 2017, ApJ, 843, 128 [Google Scholar]
- Roberts, I. D., Parker, L. C., Brown, T., et al. 2019, ApJ, 873, 42 [CrossRef] [Google Scholar]
- Rohr, E., Pillepich, A., Nelson, D., et al. 2023, MNRAS, 524, 3502 [NASA ADS] [CrossRef] [Google Scholar]
- Salim, S., Rich, R. M., Charlot, S., et al. 2007, ApJS, 173, 267 [NASA ADS] [CrossRef] [Google Scholar]
- Salim, S., Lee, J. C., Janowiecki, S., et al. 2016, ApJS, 227, 2 [NASA ADS] [CrossRef] [Google Scholar]
- Salim, S., Boquien, M., & Lee, J. C. 2018, ApJ, 859, 11 [Google Scholar]
- Sampaio, V. M., de Carvalho, R. R., Ferreras, I., et al. 2021, MNRAS, 503, 3065 [NASA ADS] [CrossRef] [Google Scholar]
- Sampaio, V. M., de Carvalho, R. R., Aragón-Salamanca, A., et al. 2024, MNRAS, 532, 982 [NASA ADS] [CrossRef] [Google Scholar]
- Schawinski, K., Urry, C. M., Simmons, B. D., et al. 2014, MNRAS, 440, 889 [Google Scholar]
- Serra, A. L., Diaferio, A., Murante, G., & Borgani, S. 2011, MNRAS, 412, 800 [NASA ADS] [Google Scholar]
- Sherman, S., Jogee, S., Florez, J., et al. 2020, MNRAS, 499, 4239 [Google Scholar]
- Shi, K., Malavasi, N., Toshikawa, J., & Zheng, X. 2024, ApJ, 961, 39 [NASA ADS] [CrossRef] [Google Scholar]
- Smith, R. J., Lucey, J. R., Price, J., Hudson, M. J., & Phillipps, S. 2012, MNRAS, 419, 3167 [NASA ADS] [CrossRef] [Google Scholar]
- Spitzer, L., Jr., & Baade, W. 1951, ApJ, 113, 413 [Google Scholar]
- Strateva, I., Ivezić, Ž., Knapp, G. R., et al. 2001, AJ, 122, 1861 [CrossRef] [Google Scholar]
- Strauss, M. A., Weinberg, D. H., Lupton, R. H., et al. 2002, AJ, 124, 1810 [Google Scholar]
- Taylor, E., Almaini, O., Merrifield, M., et al. 2023, MNRAS, 522, 2297 [NASA ADS] [CrossRef] [Google Scholar]
- Terrazas, B. A., Bell, E. F., Pillepich, A., et al. 2020, MNRAS, 493, 1888 [Google Scholar]
- Teyssier, R., Chapon, D., & Bournaud, F. 2010, ApJ, 720, L149 [NASA ADS] [CrossRef] [Google Scholar]
- Trussler, J., Maiolino, R., Maraston, C., et al. 2020, MNRAS, 491, 5406 [Google Scholar]
- van de Voort, F., Bahé, Y. M., Bower, R. G., et al. 2017, MNRAS, 466, 3460 [NASA ADS] [CrossRef] [Google Scholar]
- van den Bosch, F. C., Aquino, D., Yang, X., et al. 2008, MNRAS, 387, 79 [Google Scholar]
- van der Walt, S., Colbert, S. C., & Varoquaux, G. 2011, Comput. Sci. Eng., 13, 22 [Google Scholar]
- Vijayaraghavan, R., & Ricker, P. M. 2013, MNRAS, 435, 2713 [NASA ADS] [CrossRef] [Google Scholar]
- von der Linden, A., Wild, V., Kauffmann, G., White, S. D. M., & Weinmann, S. 2010, MNRAS, 404, 1231 [Google Scholar]
- Wang, B., & Peng, Y. 2023, ApJ, 950, L22 [NASA ADS] [CrossRef] [Google Scholar]
- Wang, S., Wang, J., For, B.-Q., et al. 2022, ApJ, 927, 66 [Google Scholar]
- Wang, T., Xu, K., Wu, Y., et al. 2024, Nature, 632, 1009 [NASA ADS] [CrossRef] [Google Scholar]
- Wang, B., Peng, Y., & Cappellari, M. 2025, Nat. Astron., 9, 165 [Google Scholar]
- Wetzel, A. R., Tinker, J. L., Conroy, C., & van den Bosch, F. C. 2013, MNRAS, 432, 336 [Google Scholar]
- Wilson, E. B. 1927, J. Am. Stat. Assoc., 22, 209 [CrossRef] [Google Scholar]
- Wright, R. J., Lagos, C. d. P., Power, C., et al. 2022, MNRAS, 516, 2891 [Google Scholar]
- Yu, H., & Diaferio, A. 2025, ApJ, 991, 220 [Google Scholar]
- Yu, H., Serra, A. L., Diaferio, A., & Baldi, M. 2015, ApJ, 810, 37 [NASA ADS] [CrossRef] [Google Scholar]
- Yu, H., Diaferio, A., Agulli, I., Aguerri, J. A. L., & Tozzi, P. 2016, ApJ, 831, 156 [CrossRef] [Google Scholar]
- Yu, H., Diaferio, A., Serra, A. L., & Baldi, M. 2018, ApJ, 860, 118 [NASA ADS] [CrossRef] [Google Scholar]
- Yun, K., Pillepich, A., Zinger, E., et al. 2019, MNRAS, 483, 1042 [Google Scholar]
- Zel’dovich, Y. B. 1970, A&A, 5, 84 [NASA ADS] [Google Scholar]
While this parameter space is frequently referred to as the projected phase space (PPS) in numerical simulation studies, we use the term R–V diagram in this work, following the historical convention in observational astronomy. Geometrically, the diagram is constructed by selecting and combining specific coordinates from the 6D phase space, rather than being a mathematical projection that involves integration over the remaining dimensions. From the perspective of classical mechanics, R and V are not canonically conjugate pairs, making the term “phase space” theoretically inaccurate.
All Tables
All Figures
|
Fig. 1. Stellar mass as a function of redshift. Top panel: Observed stellar masses (gray dots) and corresponding limiting masses (black dots) of all galaxies. Middle and bottom panels: Same relations for star-forming (blue) and quiescent (red) galaxies, respectively. Open circles mark the 95th percentiles of the limiting-mass distributions in redshift bins of width Δz = 0.01. Solid curves show the best-fit completeness relations for the corresponding subsamples, while dashed curves show the fits for the other subsamples. We adopt the quiescent-galaxy fit (red curve) as the stellar-mass completeness limit for the full sample. |
| In the text | |
|
Fig. 2. Star formation activity as a function of stellar mass for the full sample (left column) and the mass-complete sample (right column). Panels (a) and (b): logSFR versus log(M★/M⊙), while panels (c) and (d) show logsSFR versus log M★/M⊙. Red lines indicate the adopted threshold of log10sSFR/yr−1 = −11 for separating star-forming and quiescent galaxies. The solid black lines mark the stellar-mass cut of log M★/M⊙ = 9.5. Marginal histograms show the corresponding one-dimensional distributions. |
| In the text | |
|
Fig. 3. Quiescent fraction fQ in the R–V diagram. Top: Raw, binned distribution in the R–V diagram. Bins containing fewer than five galaxies are left blank (white). Bottom: Same distribution after smoothing. Dashed lines show the parallel lines (slope k = −3.7, Dou & Yu 2025) used to define the infall proxy dR. |
| In the text | |
|
Fig. 4. Distribution in the R–V diagram for cluster galaxies (red), group galaxies (orange), and isolated galaxies (blue), respectively. Colors indicate the number densities. The dashed lines show the parallel lines of Dou & Yu (2025). |
| In the text | |
|
Fig. 5. Quiescent fraction fQ as a function of stellar mass and the infall proxy dR for the full galaxy sample. The bottom-left panel shows fQ in the log M★/M⊙ − dR plane with colors indicating fQ. The top and right panels show the corresponding one-dimensional trends of fQ as a function of dR and log M★/M⊙, respectively. The bin sizes are 0.25 in both ΔdR and Δlog M★/M⊙. The fQ values in each bin are indicated by solid horizontal lines and the shaded squares show the 68% Wilson binomial confidence intervals for fQ. |
| In the text | |
|
Fig. 6. Quiescent fraction fQ for galaxies in three local environments as a function of stellar mass (left) and the infall proxy dR (right). The bin sizes are Δlog M★/M⊙ = 0.5 and ΔdR = 0.6, respectively. Cluster, group, and isolated galaxies are shown as red, orange, and blue curves, respectively. Shaded squares indicate the uncertainties in fQ. |
| In the text | |
|
Fig. 7. Quiescent fraction fQ as a function of the infall proxy dR for galaxies across different local environments and stellar-mass bins. The bin size is ΔdR = 0.6. |
| In the text | |
|
Fig. 8. Distributions of the Dn4000 index for cluster (red), group (orange), and isolated (blue) galaxies across different dR intervals. The p-values derived from two-sample Kolmogorov-Smirnov (KS) tests comparing these populations are provided in the upper left corner of each panel. The subscripts i, g, and c denote the isolated, group, and cluster galaxies, respectively. |
| In the text | |
Current usage metrics show cumulative count of Article Views (full-text article views including HTML views, PDF and ePub downloads, according to the available data) and Abstracts Views on Vision4Press platform.
Data correspond to usage on the plateform after 2015. The current usage metrics is available 48-96 hours after online publication and is updated daily on week days.
Initial download of the metrics may take a while.