


Fig. 1.
Download original image
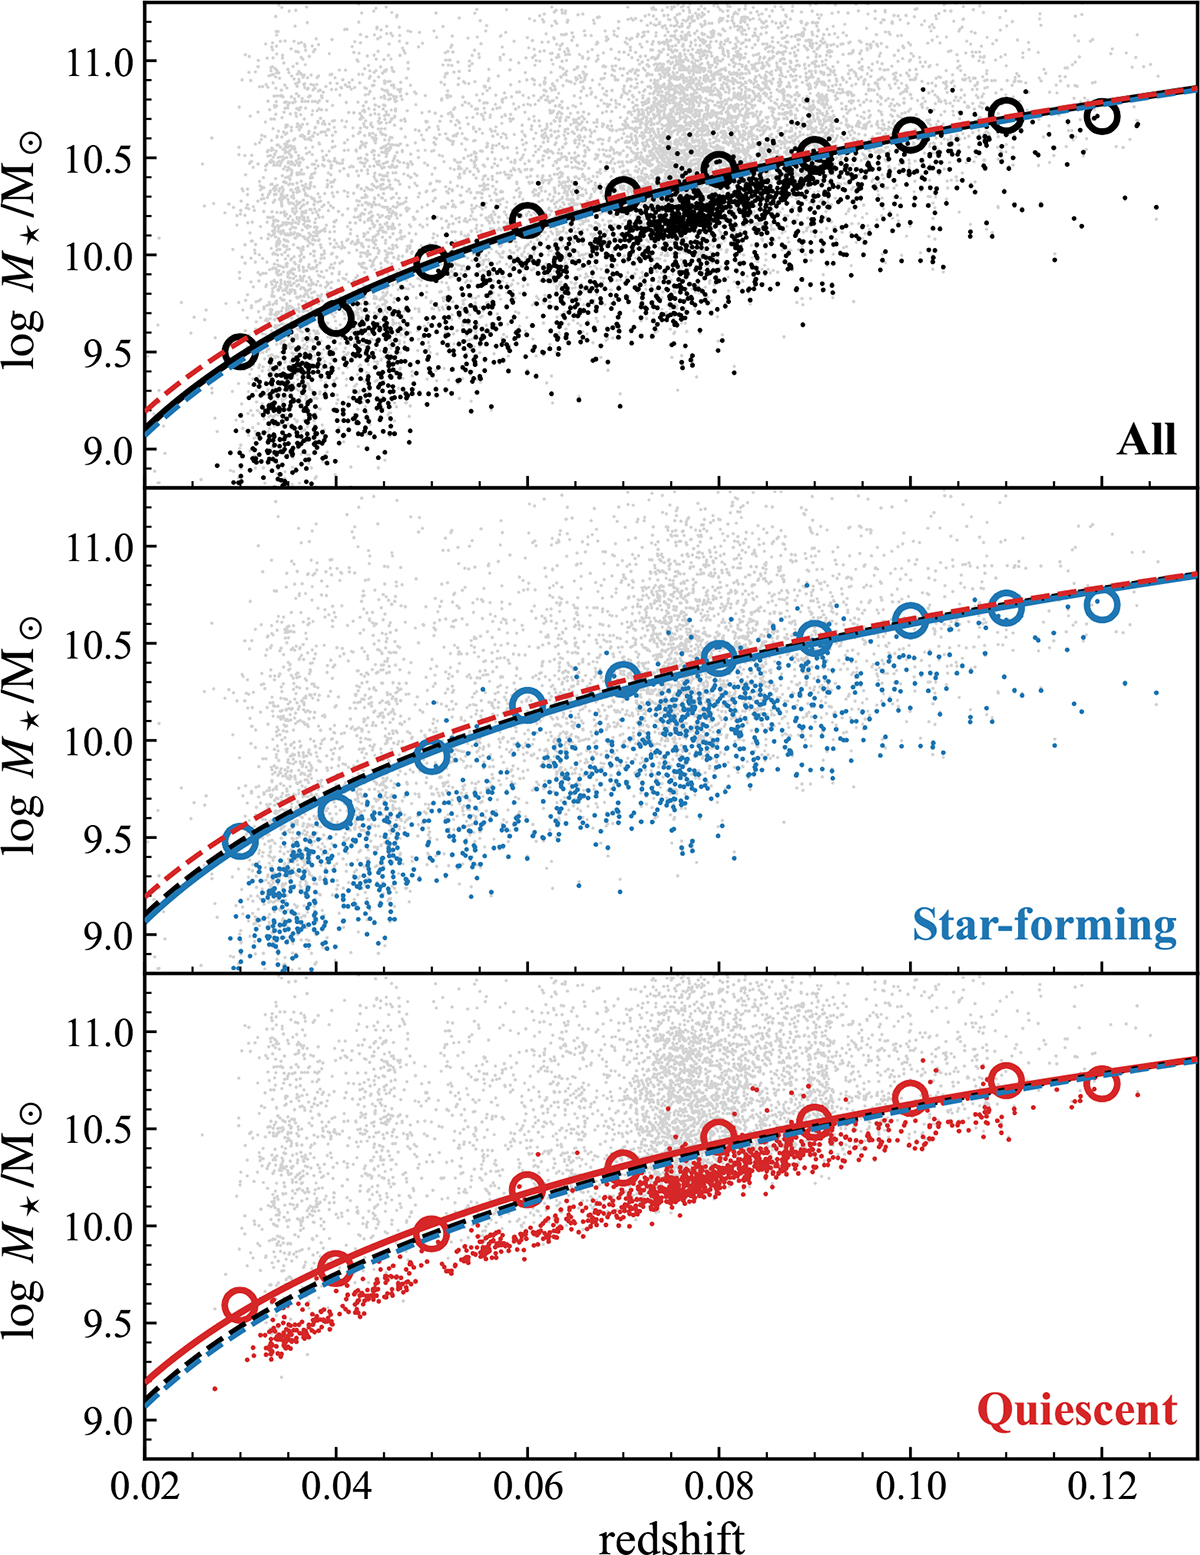
Stellar mass as a function of redshift. Top panel: Observed stellar masses (gray dots) and corresponding limiting masses (black dots) of all galaxies. Middle and bottom panels: Same relations for star-forming (blue) and quiescent (red) galaxies, respectively. Open circles mark the 95th percentiles of the limiting-mass distributions in redshift bins of width Δz = 0.01. Solid curves show the best-fit completeness relations for the corresponding subsamples, while dashed curves show the fits for the other subsamples. We adopt the quiescent-galaxy fit (red curve) as the stellar-mass completeness limit for the full sample.
Current usage metrics show cumulative count of Article Views (full-text article views including HTML views, PDF and ePub downloads, according to the available data) and Abstracts Views on Vision4Press platform.
Data correspond to usage on the plateform after 2015. The current usage metrics is available 48-96 hours after online publication and is updated daily on week days.
Initial download of the metrics may take a while.