


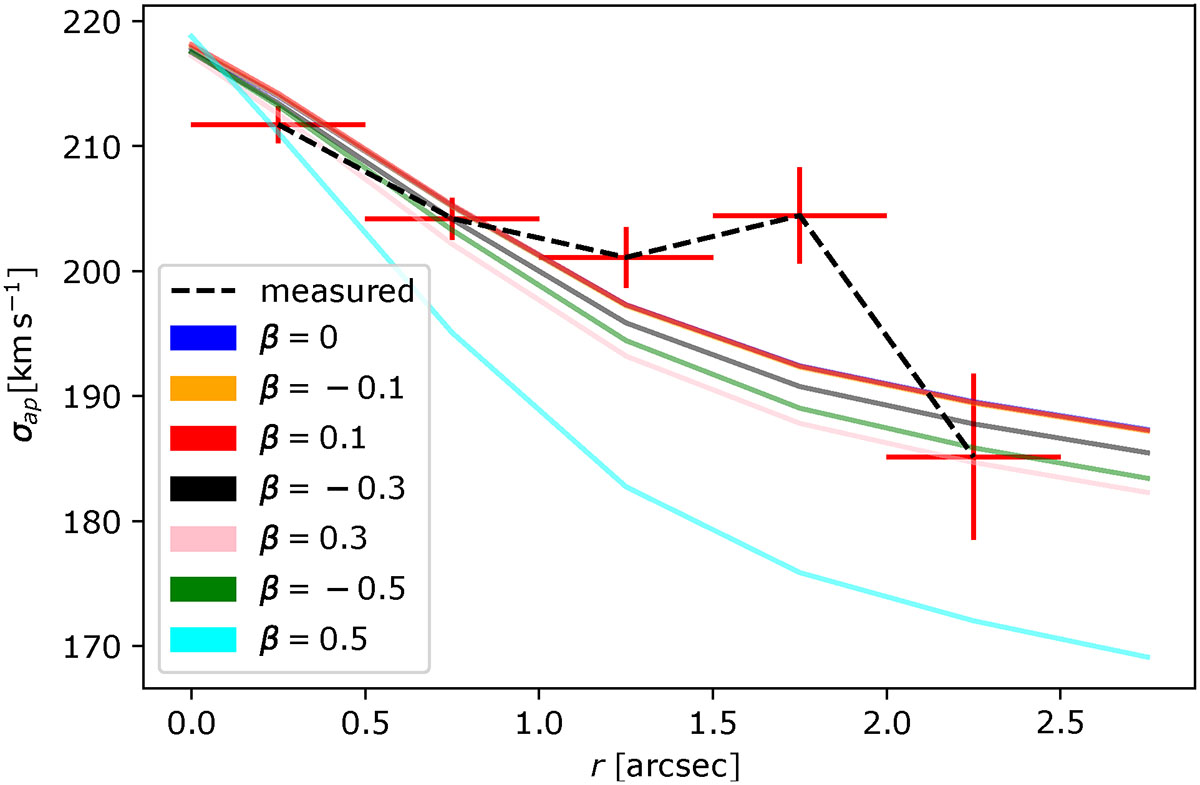
Fig. C.2.
Download original image
Comparison between the measured and model-predicted LOS velocity dispersion profiles for a cluster member (ID: 80726) in M0416 with fixed rt and different anisotropy parameter values. The σ0 value is manually fixed such that all of the model-predicted profiles show the same central σ value. The profiles are color-coded as in Fig. C.1.
Current usage metrics show cumulative count of Article Views (full-text article views including HTML views, PDF and ePub downloads, according to the available data) and Abstracts Views on Vision4Press platform.
Data correspond to usage on the plateform after 2015. The current usage metrics is available 48-96 hours after online publication and is updated daily on week days.
Initial download of the metrics may take a while.