


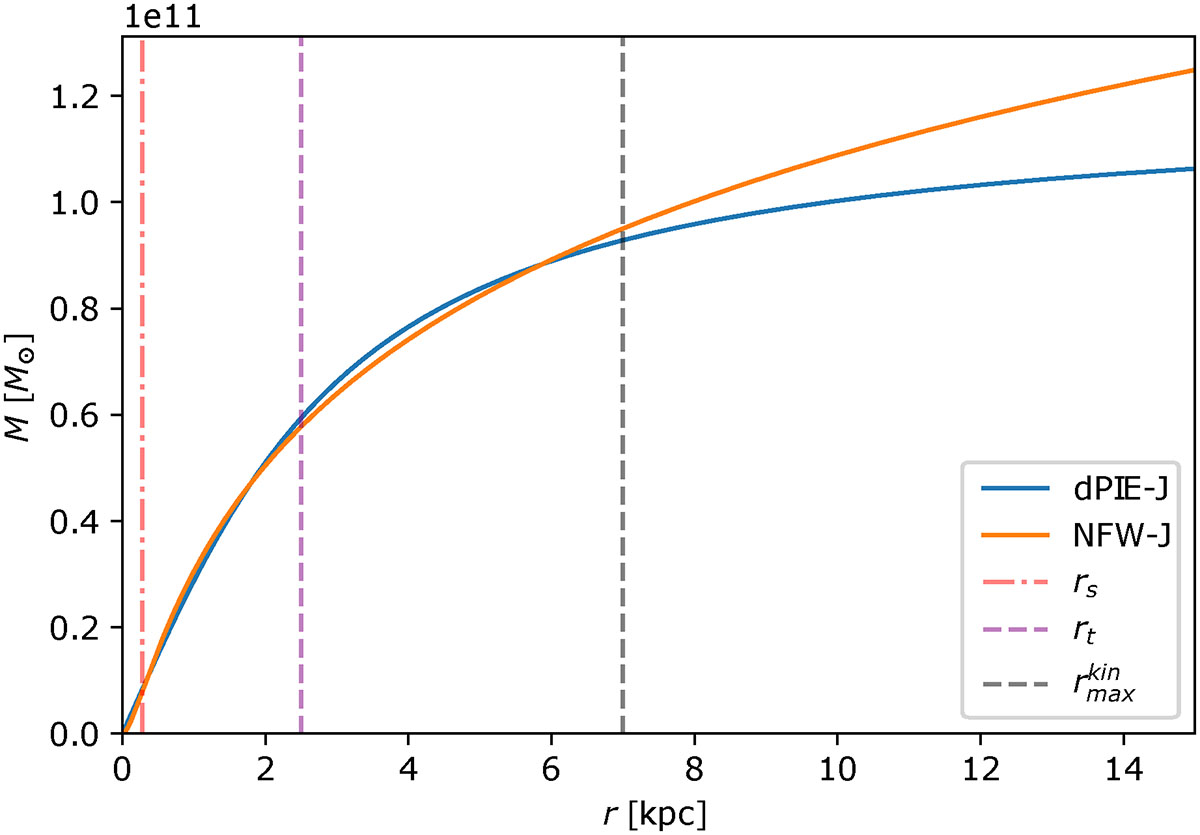
Fig. B.4.
Download original image
Comparison of the cumulative total mass profiles of a cluster member (ID: 38010) in A2744 obtained with a dPIE-J (cyan) and NFW-J (orange) dynamical models. The inferred median values of rt and rs and the maximum radius of the kinematic measurements,  are shown as a purple dashed line, a red dash-dotted line and a gray dashed line, respectively.
Current usage metrics show cumulative count of Article Views (full-text article views including HTML views, PDF and ePub downloads, according to the available data) and Abstracts Views on Vision4Press platform.
Data correspond to usage on the plateform after 2015. The current usage metrics is available 48-96 hours after online publication and is updated daily on week days.
Initial download of the metrics may take a while.