


| Issue |
A&A
Volume 711, July 2026
|
|
|---|---|---|
| Article Number | A249 | |
| Number of page(s) | 13 | |
| Section | Extragalactic astronomy | |
| DOI | https://doi.org/10.1051/0004-6361/202557695 | |
| Published online | 20 July 2026 | |
Constraining the formation of ultra-diffuse galaxies through the dynamics of their globular cluster systems
1
Departamento de Astronomía, Facultad de Ciencias Físicas y Matemáticas, Universidad de Concepción, Concepción 4030000, Chile
2
Universidad Andrés Bello, Facultad de Ciencias Exactas, Departamento de Física, Instituto de Astrofísica, Fernandez Concha 700, Las Condes, Santiago RM, Chile
3
Department of Astrophysics, American Museum of Natural History, Central Park West and 79th Street, New York, NY 10024, USA
4
Institute of Astrophysics, Facultad de Ciencias Exactas, Universidad Andrés Bello sede Concepción, Talcahuano, Chile
★ Corresponding author: This email address is being protected from spambots. You need JavaScript enabled to view it.
Received:
14
October
2025
Accepted:
29
April
2026
Abstract
Context. Ultra-diffuse galaxies (UDGs) are low-surface-brightness galaxies with a large effective radius and a stellar mass similar to that of dwarf galaxies. The overall properties of globular clusters (GCs) in UDGs provide important clues about the formation and evolution of UDGs.
Aims. We aim to provide constraints on the formation and evolution of UDGs by studying their globular cluster luminosity function (GCLF) and the spatial distribution and dynamical timescales of UDG GC systems in different environments. We also investigate whether GC properties can be used to distinguish between in situ or ex situ formation scenarios (i.e., primordial or transformed subsequently by dynamics) and explain the low nucleation fraction of UDGs.
Methods. We compiled published catalogs of GCs in UDGs, fitted Gaussian and Skew-Gaussian GCLFs, estimated mass-to-light ratios, and computed mass, density, and velocity dispersion profiles. In addition, we calculated dynamical friction and disruption timescales for the GCs.
Results. The GCLF for UDGs shows less dispersion than that for dwarf galaxies. Globular cluster systems are more centrally concentrated, with Rgc/Re < 1. A significant fraction of GCs have dynamical friction timescales shorter than a Hubble time, whereas disruption timescales are generally longer than a Hubble time.
Conclusions. The GC properties of UDGs differ from those of normal dwarf galaxies and are consistent with cored dark matter halos, where core stalling suppresses nuclear star cluster (NSC) formation. Both internal and external formation mechanisms can reproduce these properties and are likely at play. The lack of NSCs, combined with a narrow GCLF and concentrated GC distributions, supports a scenario where dynamical friction is partially inhibited in cored potentials.
Key words: galaxies: dwarf / galaxies: evolution / galaxies: formation / galaxies: star clusters: general
© The Authors 2026
 Open Access article, published by EDP Sciences, under the terms of the Creative Commons Attribution License (https://creativecommons.org/licenses/by/4.0), which permits unrestricted use, distribution, and reproduction in any medium, provided the original work is properly cited.
This article is published in open access under the Subscribe to Open model. This email address is being protected from spambots. You need JavaScript enabled to view it. to support open access publication.
1. Introduction
van Dokkum et al. (2015a) first reported ultra-diffuse galaxies (UDGs). These galaxies are defined as having a low surface brightness (LSB) level of μe = 24 − 28 mag/arcsec2, comparable to dwarf galaxies but with much larger effective radii (0.8 kpc < re < 5 kpc) than those of dwarf galaxies. Thousands of UDGs have been identified in groups and clusters (van Dokkum et al. 2015a,b; Yagi et al. 2016; Koda et al. 2015; Mihos et al. 2015; Piña et al. 2019; Lim et al. 2020; Venhola et al. 2022; La Marca et al. 2022) and also in isolated and field environments (Martínez-Delgado et al. 2016; Román & Trujillo 2017; Prole et al. 2019, 2021; Wei et al. 2026). Isolated gas-rich UDGs (Brook et al. 2021; Kong et al. 2022) show the diversity of the population and the possible environmental differences with quiescent cluster UDGs.
Their large radii are theoretically explained by a cored dark matter (DM) halo with low concentration, a shallow inner density profile, or both (Chilingarian et al. 2023; Brook et al. 2021; Kong et al. 2022; Amorisco & Loeb 2016; Di Cintio et al. 2017). Cluster UDGs present old stellar populations and no signs of actual star formation, as inferred from the absence of Hα emission. These galaxies are located on the red sequence of the color-magnitude diagram, with stellar masses 107 < M* < 108 (Koda et al. 2015). In contrast, isolated or field UDGs are bluer, star-forming, and gas-rich Prole et al. (2019). Quiescent field UDGs are less abundant and probably quenched and lost their gas in previous interactions in higher-density environments (Prole et al. 2021; Benavides et al. 2021). These galaxies represent an unusual but abundant type of galaxy in our Universe, especially in galaxy clusters, where the number of UDGs relates to the host halo mass as  (van der Burg et al. 2016, 2017).
Several authors have proposed different origins or formation mechanisms for UDGs. We distinguish them using in situ or ex situ. An in situ origin implies that no external processes are required for their formation, whereas an ex situ origin implies the opposite.
In situ formation mechanisms include strong stellar feedback that drives gas away in outflows; these outflows give rise to spatially extended stellar components and expand the DM halo, leading to cored distributions (Di Cintio et al. 2017; Chan et al. 2018). Another mechanism is the high-spin DM halo, in which UDGs form in low-mass DM halos with slightly lower than average concentration and higher than average spin, which produces a larger disk and thus lower surface brightness (Amorisco & Loeb 2016).
Ex situ formation mechanisms invoke an interaction with the environment or other galaxies in galaxy clusters or groups. These include ram-pressure stripping (RPS) (Poggianti et al. 2019; Iodice et al. 2021), which occurs when galaxies fall into the intracluster medium and encounter gas densities high enough to overcome their gravitational bond; tidal stripping through interactions with massive galaxies (Martin et al. 2019; Carleton et al. 2019), which appears to better reproduce observational abundances when progenitors have cored DM halos (Carleton et al. 2021); and collisions between dwarf galaxies (Baushev 2018; Moreno et al. 2022). Different formation mechanisms have different effects in the inner DM profiles. Scenarios involving stellar feedback tend to produce cored DM profiles, strong or repeated tidal interactions could also affect the inner DM profile, while mechanisms such as high-spin halos or RPS mainly affect the baryonic component without heavily modifying the inner DM profile. However, we note that different mechanisms may be at play simultaneously, especially in clusters environments. For instance, RPS acting in an infalling galaxy can initially compress the gas and trigger star formation; subsequent gas removal quenches star formation, eventually producing the red colors of cluster UDGs. Stellar feedback-driven outflows can produce a cored DM halo, contributing to the large effective radii
Globular clusters (GC) offer a key tracer of the galaxy dynamics and may be useful for constraining the DM profiles and the formation mechanism of UDGs. The population of UDGs exhibits an extreme range in GC richness, some being GC-rich (Beasley & Trujillo 2016; Van Dokkum et al. 2017; Lim et al. 2018) and others GC-poor, with the difference attributed to GC-rich UDGs having higher halo masses (Gannon et al. 2021). The number of GCs (NGC) has been used to estimate the total mass of galaxies (MT) (Blakeslee et al. 1997; Harris et al. 2013; Beasley et al. 2016; Zaritsky 2022). In fact, Zaritsky (2022) revisited the relation for low-mass galaxies, finding a nearly linear relationship,  down to MT ∼ 108.75 M⊙. Different formation mechanisms may lead to different GC abundances relative to stellar mass; RPS leads to larger NGC/M*, tidal heating will produce ratios comparable to those of other dwarf galaxies, and stellar feedback, specifically when coming from GCs (Trujillo-Gomez et al. 2022), may produce a relation between NGC/M* and Re (see overview in Saifollahi et al. 2022).
Because of the large radii of the stellar component of UDGs, it is reasonable to expect that the spatial distribution of GCs is also extended. Saifollahi et al. (2022) studied GCs in six UDGs in the Coma cluster, finding that the distribution of GCs relative to the half-light radius, RGC/Re, is lower for UDGs (∼1) than for dwarf galaxies (∼1.5), disfavoring formation models that redistribute the stellar component to larger radii. However, the present-day distribution of GCs may be strongly affected by dynamical friction (DF; Chandrasekhar 1943), as in the case of NGC5846-UDG1 (Bar et al. 2022), whose GCs distribution suggests mass segregation as a result of DF.
NGC1052-DF2 and NGC1052-DF4 are two peculiar UDGs that are believed to be DM-free, identified by van Dokkum et al. (2018, 2019) (for a discussion of their DM content and distance, see Trujillo et al. 2019; Montes et al. 2021, 2020), Aside from the peculiar DM of these galaxies, they exhibit a curious GC luminosity function and spatial distribution, consistent with massive centrally concentrated GCs and a lack of low-mass GCs. Simulations of tidally stripped UDGs in clusters favor a top-heavy GC mass function Carleton et al. (2021), with the subsequent central concentration of these GCs likely arising from DF. However, the lack of low-mass GCs could be an observational effect due to their low luminosities or the disruption of these GCs. We study the DF and disruption timescales of GCs in UDGs as a method to constrain which formation mechanisms are at play.
In Section 2, we describe our sample of literature data for GCs in UDGs and the methods used to derive density, mass, and velocity profiles for the UDGs, as well as to estimate the DF and disruption timescales of the GCs. In Section 3, we present our results and discuss them in Section 4. Section 5 concludes and summarizes our work.
2. Methods
We used the GC catalogs of nine UDGs (Saifollahi et al. 2021; Janssens et al. 2022; Montes et al. 2021, 2020), and we did not perform any new image reductions in this work.
Saifollahi et al. (2022) analyzed Hubble Space Telescope (HST) observations of six UDGs in the Coma cluster, obtained from three different programs using the Wide Field Channel in the Advanced Camera for Surveys (WFC/ACS) and the Wide Field Camera 3 using the Ultraviolet-Visible channel (WFC3/UVIS), providing F814W observations for all six UDGs.
Janssens et al. (2022) analyzed DGSAT-I, an isolated and quiescent UDG, using the HST/ACS instrument and Spitzer, providing F606W, F814W, IRAC1, and IRAC2 observations. Finally, Montes et al. (2021, 2020) analyzed HST/ACS observations of NGC1052–DF2 and NGC1052–DF4, complemented by ground-based imaging from the Gran Telescopio Canarias and the Isaac Newton Telescope. The data include observations in F606W, F814W, and the u, g, r, i, and z bands, and were used to search for new GC candidates, many of which have been spectroscopically confirmed (Shen et al. 2021; van Dokkum et al. 2019).
Completeness limits are not reported uniformly across all catalogs. Janssens et al. (2022) report a 50% completeness limit of F814W ∼27.1 mag for DGSAT-I, while completeness curves from Saifollahi et al. (2022) indicate 50% completeness limits around F814W ∼28 mag.
Table 1 summarizes the properties of the UDGs in the sample. All other parameters are derived or estimated, as explained in subsequent subsections. In Section 2.1, we show skewed Gaussian fits to the GCLF of the UDGs. In Section 2.3, we estimate radial profiles for mass, density, and velocity dispersion. In Section 2.2, we estimate mass-to-light ratios using the scaling relation presented in Zaritsky & Behroozi (2022), which connects photometric measurements to dynamical masses within the half-light radius. Finally, in Section 2.4, we calculate the DF and disruption timescales for all GCs in the catalogs.
Structural parameters of the UDG sample.
2.1. Globular cluster luminosity functions
To derive luminosity functions, we first estimated how magnitude errors from the observations affect our GCLF histograms through the binning process. We used a bin size of 0.5 mag for all GCLFs. Globular clusters (GCs) that fall near the edge of the bins may fall into different bins due to uncertainties in their magnitudes. To account for this uncertainty in our fitting procedure, we first performed bootstrapping with 10 000 sub-samples created from the original GC magnitudes, while folding in their observational uncertainties. We then created histograms of the GC populations for each UDG as a function of magnitude (the GCLF). We used the standard deviation of the bin heights across all realizations as a measure of the bin uncertainty.
We fitted Gaussian and skew-Gaussian functions to the GCLF. The GCLF has historically been approximated by a Gaussian shape (Secker & Harris 1993), resulting from the dynamical evolution of the initial mass function, although it is thought to follow a Schechter function (Fall & Zhang 2001; Jordan et al. 2007). Dynamical processes such as two-body relaxation, tidal shocks, and DF affect the low-mass and high-mass ends of the distributions, producing peaked distributions (Fall & Rees 1977; Kruijssen 2015). Given the diffuse nature of UDGs, we expect weak internal fields that allow low-mass GCs to survive longer, producing broader or low-mass-skewed GCLFs. Conversely, a shallow potential in UDGs may leave low-mass and outskirt GCs more susceptible to tidal stripping or external perturbations, reducing the low-mass population and narrowing the GCLF. Similarly, we expect that different potentials affect the efficiency of DF and thus the high-mass GCs.
To account for how the GCLF may be shaped by different dynamical processes affecting GCs, we also fit a skew-Gaussian function. In this case, we used the mode for the turnover magnitude, the standard deviation (as for a Gaussian), and the skewness, which provides a measure of asymmetry. For the Gaussian g(x, μg, σg) we used
 (1)
(1)
For the skew-Gaussian function s(x, ξ, ω, α) we fit the location (ξ), scale (ω), and shape (α) parameters. We then calculated the turnover magnitude (MTO), the standard deviation (σs), and the skewness (γ1) as
 (2)
(2)
where ϕ and Φ are the normal probability density function and the cumulative density function, respectively.
To properly fit these parameters, we used the nonlinear least squares algorithm implemented in curvefit from the Python package SciPy (Virtanen et al. 2020).
2.2. Mass-to-light ratio estimation
We estimated the mass-to-light ratios (Υe) using the scaling relation presented in Zaritsky & Behroozi (2022). These scaling relations connect the enclosed dynamical mass inside re with the photometric observables effective radius (re) in pc and the mean surface brightness within re (Ie) in L⊙ pc−2. In the following, we summarize the method and refer the reader to Zaritsky & Behroozi (2022) for a complete description. The method is based on the enclosed dynamical mass estimator of Wolf et al. (2010),
 (3)
(3)
where σ is the velocity dispersion in units of km s−1. Following Zaritsky & Behroozi (2022), we rewrote Eq. (3) in terms of the photometric observables re and Ie and the effective dynamical mass-to-light ratio Υe,
 (4)
(4)
Equation (4) therefore expresses the enclosed dynamical mass estimator in terms of the photometric observables and Υe. We then solved for the mass-to-light ratios using the ansatz log Υe = f(log σ, log Ie) to account for the divergence between high- and low-surface-brightness systems,
 (5)
(5)
As our Ie and re come from observations in F606W (DF2 and DF4) and F814W (Coma UDGs and DGSAT-I), we used the optical parameters fitted by Zaritsky & Behroozi (2022), which consider observations in B, V, r, g, and I, with parameters a = 0.198, b = 0.140, c = 0.192, d = −0.923, e = −0.108, and f = 1.306. The parameters obtained by Zaritsky & Behroozi (2022) come from a compilation of spheroidal stellar systems with spectroscopically measured σ, including elliptical and dwarf elliptical galaxies, UDGs, dwarf spheroidals, ultra-faint satellites of the Milky Way and M31, and compact dwarf galaxies.
van Dokkum et al. (2018), Shen et al. (2023), and Janssens et al. (2022) measured the velocity dispersions of NGC1052-DF2, NGC1052-DF4, and DGSAT-I, respectively. For the remaining UDGs in the sample, no velocity dispersion measurements are available and we estimate σ as follows.
We solved Eq. (4) self-consistently using the observed values of re and Ie, together with the scaling relation Υe(σ, Ie) from Zaritsky & Behroozi (2022). The resulting value of σ is therefore the velocity dispersion that simultaneously satisfies Eqs. (5) and (4). This corresponds to the value of σ that places each galaxy in the Zaritsky & Behroozi (2022) manifold defined by re, Ie, σ, and Υe:
 (6)
(6)
The estimated velocity dispersion is the value of σ that satisfies f(σ, re, Ie) = 0, which has a unique solution in the range 0 − 200 km s−1.
2.3. Mass, density and, velocity dispersion
To calculate the DF timescales for all GCs in our UDGs, we first computed the mass, density, and velocity dispersion profiles numerically. The mass enclosed within a radius r is required to calculate the density and velocity dispersion profiles. We obtained this by fitting observational parameters such as the Sérsic index, n, and the central intensity, I0. Following Leigh & Fragione (2020), we used equation (A.2) from Terzić & Graham (2005), which corresponds to the enclosed mass M(r):
 (7)
(7)
where γ(a, x) is the incomplete gamma function and z is a dimensionless variable defined as 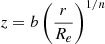 . The normalization factor ρ0 has units of density ([M⊙/pc3]) and ensures that the total mass derived from the density profile is equal to the enclosed mass:
 (8)
(8)
where Υ0 is the mass-to-light ratio. The b and p parameters depend only on the Sérsic index n and can be approximated as
 (9)
(9)
and
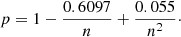 (10)
(10)
For the density profile, we used the three-parameter (ρ0, Re, n) density profile of Prugniel & Simien (1997):
 (11)
(11)
Finally, the spatial velocity dispersion profile follows equation (A.5) from Terzić & Graham (2005) which is the numerical solution of
 (12)
(12)
2.4. Dynamical friction and disruption timescale
Following the approach of Leigh & Fragione (2020) for DF2 and DF4, we investigated the collisional evolution of the observed GC populations in our UDG sample. We began by calculating the DF timescales for each GC. Dynamical friction (DF) is a process in which a moving object, such as a GC, loses momentum and kinetic energy through gravitational interactions with surrounding stars and dark matter. Stars and/or dark matter are gravitationally focused into a trailing overdensity, which pulls back on the moving GC and reduces its velocity. This results in the object gradually spiraling inward toward the center of its host galaxy.
Dynamical friction (DF) timescales shorter than a Hubble time suggest scenarios in which the GC populations have had enough time for their orbits to become more centrally concentrated. This is a key aspect of understanding the dynamical history and evolution of GCs within their host galaxies. Tremaine et al. (1975) proposed that nuclear star clusters (NSCs) could be formed through the sinking of massive GCs due to DF. This process is supported by observational and analytic works on low-mass early-type galaxies and has likely played a key role in increasing the mass budget of NSCs (Neumayer et al. 2020).
Comparing the DF timescales with the Hubble time provides valuable information on how much their initial positions have changed over time. In the cases where the DF timescales are shorter than a Hubble time, we expect that the GCs have migrated inward, meaning that their current locations do not correspond to their formation sites. This information helps reconstruct the formation and evolutionary history of GC populations in their host galaxies.
The DF timescale, tDF, assuming circular orbits, is given by (Binney & Tremaine 1987; Gnedin et al. 2014)
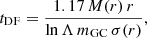 (13)
(13)
where M(r) and σ(r) are the enclosed mass and velocity dispersion at a distance r from the center of the galaxy, mGC is the GC mass, and lnΛ is the Coulomb logarithm, which we adopt as lnΛ = 10, following Leigh & Fragione (2020)
The GCs more affected by DF are the more massive and centrally located in the galaxy. Hence, as the GCs migrate deeper in the potential, the DF rate increases. As DF primarily affects high-mass GCs and thus the high-luminosity end of the GCLF, we used the disruption timescale to constrain the past evolution of the low-mass (i.e., low-luminosity) end of the GCLF. We predict a lack of low-mass GCs, especially in the denser regions of the UDGs, because their disruption timescales will be significantly shorter than a Hubble time.
To calculate the disruption timescale we used equation (8) from Lamers et al. (2005):
 (14)
(14)
where ρamb refers to the total (i.e., DM plus stellar) density at the position of the GC. We expect that any GC of low mass (< ∼ 105 M⊙) has already been disrupted, further narrowing the GCLF of UDGs.
3. Results
Here we present the results of the analysis described in Section 2. In Sect. 3.1, we present the fits to the GCLFs along with a statistical analysis of the retrieved best-fitting parameters. Section 3.2 presents the spatial distribution of the GC populations. In Sect. 3.3 we present results from our estimates of mass-to-light ratios along with our calculations of density, mass, and velocity profiles. Sections 3.4 and 3.5 present our calculations of the DF and disruption timescales, respectively, for each GC in the UDG sample. This final step addresses whether the computed dynamical timescales for GC destruction could have affected the present-day form of the GCLFs.
3.1. GCLF fits to our sample
We present our fits for the GCLFs of nine UDGs using both Gaussian and skew-Gaussian functions (Sect. 2.1). Figure 1 shows the fits and Table 2 lists the fitted parameters for both distributions, along with the number of GCs used for each UDG. For the two peculiar UDGs in NGC1052, namely DF2 and DF4, (see van Dokkum et al. 2018; Trujillo et al. 2019; Shen et al. 2021; Montes et al. 2021, 2020). we present fits to their GCLFs at 20 Mpc and 13 Mpc separately.
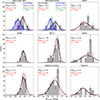 |
Fig. 1. Gaussian and skew-Gaussian GCLFs for the UDGs in our sample. Solid black lines show Gaussian fits and dashed red lines show skew-Gaussian fits. For DF2 and DF4, blue and green lines denote the Gaussian and skew-Gaussian fits, respectively, assuming a distance of 20 Mpc |
Fitted parameters for the GCLFs of UDGs in the sample.
Our Gaussian fits are consistent with those previously obtained for the UDGs in the sample: DGSAT-I (Janssens et al. 2022); DF07, DF08, DF17, DF44, DFX1, and SMDG1251014 (Saifollahi et al. 2022); and NGC1052-DF2 and NGC1052-DF4 (Montes et al. 2021, 2020). Skew-Gaussian fits are also consistent in turnover magnitudes with Gaussian peaks, as expected for cases where the absolute value of skewness is greater than ∼0.5. The other cases are γ1 < −0.5, where the Gaussian peak is brighter than the skew-Gaussian peak, and γ1 > 0.5, where the Gaussian peak is fainter than the skew-Gaussian peak. We interpret this as either an excess of low-mass GCs or a lack of high-mass GCs.
We performed Kolmogorov-Smirnov (KS) tests (Kolmogorov 1933; Smirnov 1948), as implemented in the ks_2samp function from SciPy (Virtanen et al. 2020), on the distributions of Gaussian and skew-Gaussian best-fitting GCLF parameters of our sample and the GCLF parameters of normal dwarf galaxies.
As a comparison sample, we used the table of fitted GCLF parameters for 132 dwarf galaxies in the ACS Virgo and Fornax survey provided by Villegas et al. (2010). Although the fitted GCLF come from F850LP (≈Sloan z) observations rather than F814W as in our sample, we expect that for the old stellar populations of GCs the resulting magnitude differences are small and would not affect our comparison.
We tested three null hypotheses: (i) the two cumulative distribution functions (CDFs) are equal, F(x) = G(x) for all x; (ii) F(x) ≥ G(x) for all x; and (iii) F(x) ≤ G(x) for all x, where x represents each fitted value in the KS test (i.e., peak magnitude and standard deviation). We present the results from the KS tests in Table 3.
Kolmogorov-Smirnov (KS) test results for the three hypotheses tested when comparing the GCLF parameters of our sample with those of “normal” dwarf galaxies from Villegas et al. (2010). We reject the hypothesis when p-value < 0.05.
For both fits (Gaussian and skew-Gaussian) to the UDG GCLFs, we reject the null hypothesis F(x) ≤ G(x) for the standard distribution in favor of the alternative hypothesis F(x) > G(x), where F(x) is the CDF of the standard deviations for the UDG GCLFs and G(x) that of “normal” dwarf galaxies. This can be interpreted as the GCLF of UDGs being, on average, narrower (i.e., having smaller σ) than those of “normal” dwarf galaxies.
The fitted  values span a range of ∼1.5 mag across the sample. Variations of this order are not unexpected in low-mass systems. Previous studies have shown that the GCLF turnover magnitude varies with host galaxy mass and environment (Jordan et al. 2007), and dwarf galaxies exhibit substantial scatter in the relation between the turnover magnitude and the host mass Villegas et al. (2010). In addition, the small number of GCs typically present in UDGs increases the statistical uncertainty in determining the turnover magnitude. The uncertainty introduced by the galaxy distance is negligible in our sample (except in the distance debate of NGC1052 UDGs) compared to the photometric uncertainties of the individual GCs.
3.2. Globular cluster spatial distributions
We also studied how the GCs are spatially distributed in each UDG. There is an increasing trend for UDGs having a GC half-number radius smaller than their effective radius relative to dwarf galaxies, with most UDGs having Rgc/Re < 1 and dwarfs Rgc/Re ∼ 1.5 (Janssens et al. 2022; Saifollahi et al. 2022). Tidal forces from massive galaxies and disruption may strip or destroy GCs in the outskirts, producing a centrally concentrated distribution. In particular, massive GCs experiencing DF will sink toward the galaxy center, further enhancing this centrally concentrated distribution.
We focus on the spatial distribution and how it is affected by DF and disruption processes. NGC1052-DF4 is the only UDG without Rgc/Re < 2. Montes et al. (2020) show that NGC1052-DF4 is undergoing tidal disruption by its neighboring galaxy NGC1035. Their analysis of the stellar light distribution and GC system in NGC1052-DF4 reveals an S shape reminiscent of tidal tails, and the GCs appear preferentially distributed toward NGC1035, suggesting that they are also being stripped. This could explain the large Rgc/Re value of NGC1052-DF4 shown in Figs. 2 and 3. It should also be noted that NGC1052-DF4 is the most compact (Re ∼ 1.5 kpc) and has the lowest inferred dynamical mass-to-light ratio (Υe ∼ 9.6 M⊙/L⊙). Errani & Peñarrubia (2020), Errani & Navarro (2021) argue that cuspy DM subhalos survive complete tidal disruption, retaining a bound central remnant after mass loss. The system may become increasingly DM-dominated as tidal stripping continues. In this context, the low dynamical mass-to-light ratio and clear signs of tidal stripping in NGC1052-DF4 are not expected for a strongly stripped cuspy halo. Alternatively, the DM halo could be less centrally concentrated (e.g., cored) and more susceptible to tidal stripping. Mergers between low-mass dwarf galaxies may heat the stellar component and expand the radial distribution of GCs (Leung et al. 2020). The low values of Rgc/Re in the other UDGs could indicate that they have not experienced recent tidal disruption similar to NGC1052-DF4, that DF has been strong enough to effectively drive the GCs towards the galaxy center, or that disruption processes have efficiently removed outskirt GCs. In either case, the low Rgc/Re values cannot be explained solely by environmental effects, as they are observed in UDGs across the different environments: DGSAT-I in the field, NGC1052-DF2 in a group, and the rest belonging to the Coma cluster. Similarly, the low gas densities in the outskirts of UDGs would form lower-mass GCs (Kruijssen 2012; Reina-Campos & Kruijssen 2017). These GCs would be weakly bound to the host UDG and therefore more likely to be removed by tidal stripping, leading to a bias toward high-mass GC survivors. This effect would be particularly notable between field and cluster UDGs.
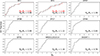 |
Fig. 2. Cumulative density histograms of GC spatial distributions in their respective UDGs, normalized by the effective radius, Re. For DF2 and DF4, we test two distance hypotheses, 13 and 20 Mpc, respectively. Rgc/Re values are from the literature, with * from Saifollahi et al. (2022) and ** from Janssens et al. (2022). |
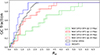 |
Fig. 3. Cumulative density histograms of the GC spatial distributions. The blue histogram represents DGSAT-I, the black histogram represents the stacked Coma cluster UDGs, the red histograms represent NGC1052-DF2 and the green histograms represent NGC1052-DF4, at 13 Mpc (solid line) and 20 Mpc (dashed line). |
3.3. Estimation of radial profiles
Using the equations presented in Section 2, we estimated the mass-to-light ratios (see Sect. 2.2) and calculated the radial profiles of the enclosed mass, density, and velocity dispersion (see Sect. 2.3) for the UDGs in our sample. We present the results of these calculations in Table 4 and show the corresponding profiles in Fig. 4.
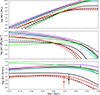 |
Fig. 4. Top panel: Enclosed mass of each UDGs as a function of radius. Middle panel: Density profile as a function of radius. Bottom panel: Velocity dispersion profile. The dots represent the measured velocity dispersions for DF2, DF4, and DGSAT-I at Re (Emsellem et al. 2019; Shen et al. 2023; Janssens et al. 2022, respectively). The color coding is as follows: DF2, black (dashed line: 13 Mpc; solid line: 20 Mpc); DF4, red (dashed line 13 Mpc; solid line 20 Mpc); DF07, blue; DF08, turquoise; DF17, green; DF44, pink; DFX1, brown; SMDG1251014, violet; and DGSAT-I, lime. |
Derived physical properties at one effective radius.
3.4. Dynamical friction timescales
To construct DF timescales, we considered two test GCs of fixed initial masses of 106 and 104 M⊙ and calculated the DF as a function of r. Figure 5 shows that for our test GC mass of 106 M⊙, the DF timescale becomes increasingly important within the inner ∼3 kpc. For the test GC with a mass of 104 M⊙, it becomes relevant in the innermost regions of the UDGs (< 0.5 kpc) only, where the drop-in time due to DF is at its shortest.
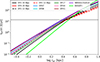 |
Fig. 5. Dynamical friction radial profiles for each UDG in the sample, assuming a GC mass of 106 M⊙. The horizontal black line corresponds to a Hubble time of ∼13.7 Gyr. The color coding is as follows: DF2, black; DF4, red; DF07, blue; DF08, turquoise; DF17, green; DF44, pink; DFX1, brown; SMDG1251014, violet; and DGSAT-I, lime. |
Using Equation (13) and the profiles presented in Section 3.3, we calculated DF timescales (tdf) for each GC in our UDGs. We present the results in Fig. 6. We derived each GC mass assuming a mass-to-light ratio of 2 M⊙/L⊙, which is suitable for older stellar populations without significant dark matter. Table 2 lists the number of GCs for which tdf is calculated. Figure 6 shows that several GCs, especially in the inner regions (Rgc/Re < 1), have tdf timescales shorter than a Hubble time (∼13.7 Gyr). We expect these GCs to have lost significant orbital energy and sunk deeper into their host galaxy potential well. We note that GC mass loss and orbital sinking due to DF are coupled processes (Madrid et al. 2017). Although our results rely on static approximations for DF and disruption, they should be sufficient for the scope of this work.
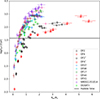 |
Fig. 6. Dynamical friction timescales for each GCs in the UDGs as a function of galactocentric radius, normalized by the effective radius of each host galaxy. The horizontal black line represents a Hubble time of ∼13.7 Gyr. The color coding is as follows: DF2, black (dashed line: 13 Mpc; solid line: 20 Mpc); DF4, red (dashed line: 13 Mpc; solid line: 20 Mpc); DF07, blue; DF08, turquoise; DF17, green; DF44, pink; DFX1, brown; SMDG1251014, violet; and DGSAT-I, lime. * Assuming a distance of 20 Mpc instead of 13 Mpc. |
We present the fraction of GCs with tdf shorter than a Hubble time (fdf < H) and the fraction of GCs with galactocentric radii less than the Re of their host (fr < Re) in Table 5.
Dynamical friction timescale fractions for the GC samples.
3.5. Disruption timescales
We created radial profiles of disruption timescales for GC masses of 104 and 106 M⊙, as shown in Fig. 7. A GC with a mass of 106 M⊙ has disruption timescales that exceed a Hubble time and thus has not been disrupted. In contrast, a GC of mass of 104 M⊙ has a disruption timescale shorter than a Hubble time. Therefore, it is likely that the lower-mass GCs have already been disrupted. This provides a minimum limit for the GCLF around ∼ − 5.5 F814W (104 M⊙), assuming an M/L of 2 for the GC stellar populations.
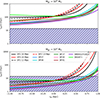 |
Fig. 7. Disruption timescale profiles for each UDG in the sample, assuming GC masses of 106 M⊙ (top panel) and 104 M⊙ (bottom panel). The horizontal black line corresponds to a Hubble time of ∼13.7 Gyr. The color coding is as follows: DF2, black (dashed line: 13 Mpc; solid line: 20 Mpc); DF4, red (dashed line: 13 Mpc; solid line: 20 Mpc); DF07, blue; DF08, turquoise; DF17, green; DF44, pink; DFX1, brown; SMDG1251014, violet; and DGSAT-I, lime. |
We show the disruption timescales of the GCs in Fig. 8. All disruption timescales are near or well above a Hubble time (∼13.7 Gyr). Due to the large disruption timescales, we expect the present population to be dynamically stable. However, we cannot rule out that GCs with lower disruption timescales have already been destroyed and are thus absent from the present population.
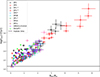 |
Fig. 8. Disruption timescales for individual GC in each UDG. The horizontal black line represents a Hubble time ∼13.7 Gyr. |
4. Discussion
In this section, we discuss our results for each individual galaxy or galaxy cluster and compare them to investigate their formation histories.
4.1. Coma UDGs
The GCLFs of UDGs in the Coma cluster exhibit smaller dispersions compared to those of typical dwarf galaxies Villegas et al. (2010). Skew-Gaussian fits to the GCLFs (see Fig. 1) reveal mild asymmetries. Most Coma UDGs show a tendency for negative skewness, except DF07. The interpretation of this asymmetry should be treated with caution, as the observations of Saifollahi et al. (2022) are only ∼50% complete at F814W ≈28 mag, corresponding to the low-mass end of the distribution (∼5 × 10⁴ M⊙). In addition, the Coma UDGs contain between ten GCs (DF08) and 30 GCs (SMDG1251014). Therefore, possible missing low-mass GCs and small-number statistics may influence the skewness of the GCLF. We therefore use skewness primarily as a descriptive parameter of the observed distribution rather than as evidence for low- or high-mass. Although we assume that all Coma UDGs lie at the distance of the Coma cluster (D ≈ 100 Mpc). Assuming a ∼1 Mpc virial radius for Coma, variations in the distance modulus with a ±1 Mpc distance uncertainty are ∼0.02 mag. Therefore, uncertainties related to the distances of these UDGs are significantly smaller than our typical uncertainties in the turnover magnitude (∼0.15 mag), and cluster depth effects are unlikely to meaningfully affect our results. The bottom panel of Fig. 7 shows that the disruption of low-mass GCs could have contributed to the narrowing of the GCLF below log(mgc/M⊙) = 4. Fig. 9 shows that the GCs in Coma UDGs are prone to disruption up to log(mgc/M⊙) = 5 in the inner regions.
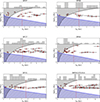 |
Fig. 9. Radial distribution of GC masses as a function of galactocentric distance for Coma UDGs. Shaded gray and blue regions represent tdf < th and tdis < th, respectively. The vertical dashed red line represents Re. |
Coma UDGs follow the general Rgc/Re trend observed in UDG systems (Janssens et al. 2022), with an average value of Rgc/Re = 1.01. This value is noticeably lower than that for dwarf galaxies (Rgc/Re ∼ 1.5; Saifollahi et al. 2022). Approximately half of the GCs in Coma UDGs are located within their effective radii (fr < re = 0.54). This reflects a more centrally concentrated distribution of GCs for UDGs than for dwarf galaxies, consistent with the Rgc/Re values.
The narrower GCLF and the lower Rgc/Re ratio in UDGs could suggest that dynamical processes play a significant role, such as the disruption of low-mass GCs and the DF that acts preferentially on massive GCs. These processes may explain the observed central spatial distribution (see Fig. 2) of GCs despite the large Re characteristic of UDGs.
The DF timescales for Coma UDGs indicate that, on average, one quarter (ftdf < tH = 0.26) of their GCs have timescales shorter than a Hubble time. All GCs with tdf < th lie inside Re. This suggests that we may have caught them just before they sink deeper and form an NSC Tremaine et al. (1975). Alternatively, GCs may be stalled because of decreased DF effectiveness due to core stalling in a cored halo Read et al. (2006).
As shown in Fig. 9, the most massive GCs in DF17 lie outside 1 Re. DF17 also has a remarkably low fraction of GCs with tdf < th. The low abundance of GCs in the innermost part of DF17 is intriguing. With DF timescales shorter than a Hubble time, NSC formation could explain the lack of preferentially high-mass GCs. However, DF17 shows no evidence of a central NSC, possibly due to core stalling.
4.2. NGC1052 UDGs
In this subsection, we compare DF2 and DF4 for both proposed distances: 13 Mpc (Trujillo et al. 2019; Montes et al. 2021, 2020) and 20 Mpc (van Dokkum et al. 2018, 2019; Shen et al. 2021). We also compare them with other UDGs and normal dwarf galaxies.
The GCLFs of DF2 and DF4 in the NGC1052 group exhibit smaller σgclf than typical dwarf galaxies, with a mean σgclf of 0.59 assuming a distance of d = 13 Mpc, or 0.54 assuming d = 20 Mpc. Skew-Gaussian fits reveal a tendency for positive skewness, indicative of a shift of the observed GCLF distribution toward high-mass GCs. However, Fahrion et al. (2025) recently spectroscopically confirmed four new GCs associated with NGC1052-DF2, fainter than the GCLF turnover magnitude, with apparent magnitudes ∼23.4 mag and projected positions within Re for three of them. These new GCs would slightly decrease the Rgc/Re ratio for NGC1052-DF2, while shifting the GCLF peak toward lower magnitudes and possibly reducing the positive skewness parameter we find. The confirmation of these four GCs faint GCs highlights what was already discussed in Section 4.1: the skewness parameter is affected by low number statistics and completeness issues.
The spatial distribution of the GCs differs significantly between DF2 and DF4. In the case of DF2, it follows the typical Rgc/Re < 1 trend observed in UDGs, with values of 0.91 at 13 Mpc and 0.96 at 20 Mpc. Approximately half of its GCs are located within 1 Re (fr < re = 0.50 and 0.57, assuming distances of 13 and 20 Mpc, respectively). In contrast, DF4 deviates substantially from this trend, with Rgc/Re values of 2.32 at 13 Mpc and 2.44 at 20 Mpc. Montes et al. (2020) propose that DF4 is undergoing tidal disruption due to its interaction with NGC1035, which affects both its dark matter content and its GC system. For DF4, several GCs lie outside rtidal (seven of 11 GCs; see Fig. 10), the radius at which tidal effects become significant. Thus, the high Rgc/Re value can be explained by tidal interaction with NGC1035.
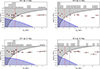 |
Fig. 10. Globular cluster masses in solar units as a function of galactocentric distance (kpc) for UDGs in NGC1052. The top rows assume a distance of 13 Mpc, while the bottom rows assume 20 Mpc. Shaded black and blue regions represent tdf < th and tdis < th, respectively. The vertical dashed red line represents Re, and the dashed gray line shows rtidal for DF4 as calculated by Montes et al. (2020). |
The dynamical processes acting on DF2 and DF4 are key to understanding their GC systems. DF2 has the highest fraction of GCs in our sample with DF timescales shorter than a Hubble time: fdf < H = 0.57 at 13 Mpc and fdf < H = 0.64 at 20 Mpc. Fig. 10 shows that DF2 is heavily dominated by DF within its Re. DF2 is the only UDG in the sample with GCs outside Re that have tdf < th. This is mainly due to DF2 being less dense and therefore encloses less mass, since tDF ∝ M(r).
4.3. DGSAT-I
DGSAT-I, the only isolated UDG in our sample, exhibits a GCLF with a bright peak magnitude and a dispersion (σ = 0.8) closer to that of normal dwarf galaxies. A skew-Gaussian fit reveals a positive skewness of γ1 = 0.56, suggesting a higher relative abundance of high-mass GCs compared to low-mass ones.
The spatial distribution of GCs in DGSAT-I follows the general Rgc/Re trend observed in UDGs, with Rgc/Re = 0.67 (Janssens et al. 2022). We expect this to be a primordial property of UDGs, as the low fraction of GCs with DF timescales shorter than a Hubble time (fdf < H = 0.33) suggests that DF has not been the main mechanism concentrating the GCs inside Re.
In contrast, the remaining GCs with DF timescales exceeding a Hubble time are expected to remain in their present orbits. This suggests that the current distribution of GCs outside Re may closely reflect their spatial distribution at formation or after orbital expansion. The latter may be driven by fluctuations in the gravitational potential produced by feedback from the concentrated burst of star formation, which can reconfigure the DM halo (Pontzen & Governato 2012).
4.4. Dynamical effects on GCs
The observed GC disruption timescales generally exceed a Hubble time, suggesting that the surviving clusters are resistant to the tidal field effects from their host galaxies.
Fig. 9 shows Coma cluster UDG globular clusters in the Mgc-Rgc parameter space, along with shaded regions where the DF timescale is lower than a Hubble time tdf < th (shaded gray regions) and where the disruption timescale is shorter than a Hubble time tdis < th (shaded blue regions). Fig. 10 shows the same analysis for UDGs DF2 and DF4 in NGC1052. We present our results assuming distances of both 13 Mpc (Trujillo et al. 2019) and 20 Mpc (van Dokkum et al. 2019; Shen et al. 2021). For DF4 we include the tidal radius (rtidal) calculated by Montes et al. (2020). Finally, Fig. 11 shows our isolated UDG in the DGSAT-I sample.
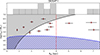 |
Fig. 11. Radial distribution of GC masses as a function of galactocentric distance for DGSAT-I. Shaded black and blue regions represent tdf < th and tdis < th, respectively. Vertical dashed red lines represent Re. |
An analysis of the regions where the disruption timescales dominate reveals a critical mass threshold of ∼104.5 M⊙ (see Figs. 9, 10, and 11), below which the disruption timescales become shorter than a Hubble time. This suggests that low-mass GCs may have been disrupted. We note that the disruption curves shown here represent long-term dynamical evolution in the UDG potentials. However, GCs can also experience significant early disruption shortly after their formation due to interactions with dense gas structures in the natal interstellar medium (e.g. Kruijssen 2012, 2015). In this scenario, even relatively massive clusters could have been destroyed during the early phases of galaxy evolution, before the dynamical evolution considered in this work.
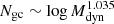
Compared to dwarf galaxies in the Coma cluster (Zöller et al. 2024), at fixed rgc/Re we find that the predicted DF timescales in UDGs are typically ∼1 − 2 dex larger and disruption timescales are ∼0.2 − 0.4 dex larger. This indicates that, while DF may play a significant role in shaping the GC spatial distributions in UDGs, the overall survival of clusters is governed by similar mechanisms operating on comparable timescales in both UDGs and dwarfs. This suggests that the disruption of low-mass GCs is not the primary mechanism for the narrower GCLF of UDGs. Harris et al. (2013) studied the GC populations of 422 galaxies and found a correlation between galaxy dynamical mass (Mdyn) and both the number of GCs and their mean mass. We estimated dynamical masses within Re using the relations of Zaritsky & Behroozi (2022), providing an estimate of Mdyn estimation independent of Ngc. The inferred Mdyn values should be interpreted with caution as they are derived from scaling relations rather than direct Mdyn measurements. Fig. 12 shows that UDGs have Ngc values consistent with the fit for dwarf elliptical (dE) galaxies, but higher ⟨mgc⟩ for their Mdyn.
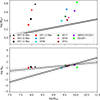 |
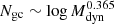
Fig. 12. Top panel: Average GC mass ⟨mgc⟩ as a function of dynamical mass Mdyn for the UDGs in our sample. The black line represents the best-fit relation log |

Danieli et al. (2022) studied the extreme GC rich UDG NGC5846-UDG1, which hosts 54 ± 9 GCs with a galaxy luminosity of LV, gal ≈ 6 × 10⁷ L⊙ and a total GC luminosity of LV, GCs ≈ 7.6 × 10⁶ L⊙. They infer that most of the star formation likely occurred in GCs, implying that extreme conditions during early galaxy formation promoted star formation in massive, dense clumps. In addition, semi-empirical models predict that galaxy evolution driven by feedback from massive star clusters located ≳0.5 dex above the mean SMHM relation at Mhalo = 1010 M⊙ will host GC populations that are a factor of ∼10−100 larger. Feedback from these GCs drives expansion of the stellar component and loss of DM Trujillo-Gomez et al. (2022). This could explain the high ⟨mgc⟩ observed in the UDGs.
4.5. Why we do not see NSCs
We calculated short DF timescales for several GCs within Re for our UDGs. However, none of the UDGs in our sample shows evidence of NSCs, which can potentially form by the sinking of GCs into the galaxy center due to DF (Tremaine et al. 1975). This implies that either a process prevents NSC formation or we are catching the UDGs just before NSC formation (which should have a low probability, since there is no a priori reason for all UDGs in our sample to approach this limit and not surpass it within a Hubble time).
Lambert et al. (2024) find that UDGs have a lower MNSC/M* ratio than dwarf galaxies. This is consistent with our findings of longer DF timescales in UDGs, since the build-up of NSC mass through GCs sinking into the galaxy center would be slower and less efficient in UDGs. This suggests that NSC formation in UDGs is generally less efficient than in dwarf galaxies, likely because of primordial differences in their density profiles, which determine the distribution of DF and disruption timescales as a function of galactocentric distance.
Studying the strongly mass-segregated UDG NGC5846-UDG1, Bar et al. (2022) find that DF can explain the mass segregation of GCs, and that the galaxy may be in an intermediate state where a nucleus has not yet formed. Our galaxies may either be in this intermediate state or in an earlier phase, as our UDGs show no clear signal of mass segregation within the observable GCs.
Semi-analytical methods such as ours and that of Bar et al. (2022) are in good agreement with simulations of cuspy galaxy halos, where tdf decreases constantly as the radius from the galaxy center decreases. In contrast, N-body simulations of GC orbits in cored density profiles (Read et al. 2006; Cole et al. 2012; see also Leung et al. 2020; Dattathri et al. 2025) show that DF may be suppressed near the core radius, leading to a stalling of GC infall, commonly referred to as core stalling. Reduced GC inspiral may also arise in alternative DM scenarios such as self-interacting dark matter (SIDM), where self-interactions modify the strength of DF (Fischer & Sagunski 2024). However, recent work suggests that even though SIDM halos may develop central cores, massive perturbers can still efficiently sink to the center depending on the detailed phase-space structure of the halo (van den Bosch & Dattathri 2026).
At face value, the lack of NSCs in our UDGs is puzzling, given that we estimate DF timescales for the inner GCs that are several orders of magnitude shorter than a Hubble time. This tension can be explained if UDGs have cored density profiles in which the effects of DF are suppressed due to the flattened density profile. This effect is not captured in our method due to the rather cuspy profile of our model and our semi-analytic approach.
Simulations of different UDG formation scenarios show a transition from cuspy to cored halos over time. For example, Di Cintio et al. (2017) use zoom-in cosmological simulations and find that UDG analogs form through the expansion of DM and stellar content due to episodes of gas outflow associated with star formation. These UDG analogs experienced a change in the inner slope γ of the DM halo from γ ∼ 1 at z = 4 to γ = 0 at z = 0 (see panel d of Fig. 3 in Di Cintio et al. 2017), indicating the transition from cuspy to cored halos in UDGs.
In cluster and group environments, Carleton et al. (2019) studied the effects of tidal stripping and heating on the stellar mass and half-light radius of dwarf satellites in cuspy and cored halos. Their analysis shows that tidally stripped dwarf galaxies in cored halos can reproduce the observed sizes and stellar masses of UDGs in denser environments. Assuming that no single formation mechanism is responsible for the origin of all UDGs, it is likely that a complex interplay of mechanisms is at play. This suggests that cored halos could be a universal property of UDGs. Consequently, core stalling of GCs is expected to occur in most, if not all, UDGs. This is consistent with our results of low DF timescales and the lack of an NSC.
Because core stalling (Read et al. 2006; Cole et al. 2012) is likely in UDGs, we expect a low frequency of NSCs, which is consistent with observations. The nucleation fraction of UDGs in the cores of galaxy clusters (fnuc, UDG ≈ 40%) is lower than that of typical dwarf galaxies (fnuc ≈ 60%) and decreases to 0 − 20% in cluster outskirts (Lim et al. 2018). Observational studies also report low NSC masses and occupation fractions in UDGs compared to typical dwarf galaxies (e.g., Amorisco et al. 2018; Lim et al. 2018; Prole et al. 2019). Semi-analytic modeling by Leaman & Ven (2021) similarly suggests that NSC formation via GC inspiral can be inefficient depending on galaxy structure and cluster properties.
5. Conclusions
In this work, we analyze the GC populations of UDGs, their luminosity functions, spatial distributions, and dynamical timescales. Through our analysis, we constrain the possible formation mechanisms for UDGs as a function of environment (where possible) and compare the results with the known properties of normal dwarf galaxies. Our results are as follows.
-
Fits to the GCLFs of UDGs show that their peak luminosity is statistically consistent with that of dwarf galaxies, but a p-value = 0.027 rejects consistency in their dispersion and favors UDGs having narrower GCLFs.
-
The emerging trend of UDGs that have Rgc/Re < 1 cannot be fully explained by DF, as most UDGs show an fdf < H (fraction of GCs with tdf less than a Hubble time) significantly smaller than fr < Re (fraction of GCs inside Re).
-
The disruption timescales of the GCs show that although low-mass GCs may have been effectively disrupted, the small difference in disruption timescales between UDGs and dwarfs (0.2−0.4 dex) likely rules out disruption as the reason for different GCLFs.
-
Dynamical friction timescales for GCs in the inner regions of UDGs are well below a Hubble time, yet we find no evidence of NSCs. This is most likely due to core stalling and dynamical buoyancy of GCs due to the cored density profile of UDGs. Hence, the high-mass end of the GCLF remains unexplained since we do not observe NCS in UDGs. This suggests that DF cannot explain a paucity of GCs at the high-mass end. Therefore, our results are consistent with these differences being primordial. This preliminary result should be confirmed with larger datasets in the future, which we hope to address in future work.
Our results are broadly consistent with UDG formation scenarios in which the stellar component is redistributed to larger radii, lowering the surface brightness and potentially producing cored dark matter halos (e.g., via stellar feedback, tidal heating, or tidal stripping). The observed small Rgc/Re ratios are consistent with DF acting on GCs after such expansion processes, although the puzzling lack of NSCs requires further investigation of the DM profiles of UDGs.
Our results are compatible with either a common formation pathway for UDGs (i.e., environmentally independent) or with multiple formation mechanisms that produce similar observable properties in their GC systems. Distinguishing between these possible formation mechanisms remains difficult.
Finally, our analysis does not provide strong constraints on the environmental effects in the formation of UDGs. We do not find significant differences in the GC properties of UDGs across the environments sampled here nor clear evidence that dynamical processes affect GC systems differently with environment. To robustly test environmental differences, larger samples of UDGs, specifically from low- and medium-density environments, are required. We are optimistic that upcoming all-sky and deeper surveys in the coming years will significantly expand the known population of UDGs and their GC systems, allowing the statistical trends discussed here to be tested with much larger samples.
Acknowledgments
We thank the anonymous referee for a constructive report. NWCL gratefully acknowledges the generous support of a Fondecyt General grant 1230082, as well as support from Millenium Nucleus NCN2023_002 (TITANs) and funding via the BASAL Centro de Excelencia en Astrofisica y Tecnologias Afines (CATA) grant PFB-06/2007. NWCL also thanks support from ANID BASAL project ACE210002 and ANID BASAL projects ACE210002 and FB210003. R.D. gratefully acknowledges support by the ANID BASAL project FB210003. P.A.S. acknowledges support from ANID BASAL project FB210003 (CATA) and Millennium Nucleus NCN2023_002 (TITANs) during part of the development of this work.
References
- Amorisco, N. C., & Loeb, A. 2016, MNRAS, 459, L51 [NASA ADS] [CrossRef] [Google Scholar]
- Amorisco, N. C., Monachesi, A., Agnello, A., & White, S. D. M. 2018, MNRAS, 475, 4235 [NASA ADS] [CrossRef] [Google Scholar]
- Bar, N., Danieli, S., & Blum, K. 2022, ApJ, 932, L10 [NASA ADS] [CrossRef] [Google Scholar]
- Baushev, A. N. 2018, New Astron., 60, 69 [CrossRef] [Google Scholar]
- Beasley, M. A., & Trujillo, I. 2016, ApJ, 830, 23 [CrossRef] [Google Scholar]
- Beasley, M. A., Romanowsky, A. J., Pota, V., et al. 2016, ApJ, 819, L20 [NASA ADS] [CrossRef] [Google Scholar]
- Benavides, J. A., Sales, L. V., Abadi, M. G., et al. 2021, Nat. Astron., 5, 1255 [NASA ADS] [CrossRef] [Google Scholar]
- Binney, J., & Tremaine, S. 1987, Galactic dynamics (Princeton, NJ: PrincetonUniversity Press) [Google Scholar]
- Blakeslee, J. P., Tonry, J. L., & Metzger, M. R. 1997, AJ, 114, 482 [Google Scholar]
- Brook, C. B., Di Cintio, A., Macciò, A. V., & Blank, M. 2021, ApJ, 919, L1 [NASA ADS] [CrossRef] [Google Scholar]
- Carleton, T., Errani, R., Cooper, M., et al. 2019, MNRAS, 485, 382 [NASA ADS] [CrossRef] [Google Scholar]
- Carleton, T., Guo, Y., Munshi, F., Tremmel, M., & Wright, A. 2021, MNRAS, 502, 398 [NASA ADS] [CrossRef] [Google Scholar]
- Chan, T. K., Kereš, D., Wetzel, A., et al. 2018, MNRAS, 478, 906 [NASA ADS] [CrossRef] [Google Scholar]
- Chandrasekhar, S. 1943, ApJ, 97, 255 [Google Scholar]
- Chilingarian, I., Grishin, K., Afanasiev, A. V., et al. 2023, Proceedings of the IAU Symposium 379 (Dynamical Masses of Local Group Galaxies), accepted [Google Scholar]
- Cole, D. R., Dehnen, W., Read, J. I., & Wilkinson, M. I. 2012, MNRAS, 426, 601 [Google Scholar]
- Danieli, S., van Dokkum, P., Trujillo-Gomez, S., et al. 2022, ApJ, 927, L28 [NASA ADS] [CrossRef] [Google Scholar]
- Dattathri, S., Bosch, F. C. V. D., Banik, U., et al. 2025, ArXiv e-prints [arXiv:2511.11804] [Google Scholar]
- Di Cintio, A., Brook, C. B., Dutton, A. A., et al. 2017, MNRAS, 466, L1 [NASA ADS] [CrossRef] [Google Scholar]
- Emsellem, E., Burg, R. F. J. V. D., Fensch, J., et al. 2019, A&A, 625, A76 [NASA ADS] [CrossRef] [EDP Sciences] [Google Scholar]
- Errani, R., & Navarro, J. F. 2021, MNRAS, 505, 18 [NASA ADS] [CrossRef] [Google Scholar]
- Errani, R., & Peñarrubia, J. 2020, MNRAS, 491, 4591 [Google Scholar]
- Fahrion, K., Beasley, M. A., Gvozdenko, A., et al. 2025, A&A, 697, A145 [NASA ADS] [CrossRef] [EDP Sciences] [Google Scholar]
- Fall, S. M., & Rees, M. J. 1977, MNRAS, 181, 37P [NASA ADS] [CrossRef] [Google Scholar]
- Fall, S. M., & Zhang, Q. 2001, ApJ, 561, 751 [NASA ADS] [CrossRef] [Google Scholar]
- Fischer, M. S., & Sagunski, L. 2024, A&A, 690, A299 [NASA ADS] [CrossRef] [EDP Sciences] [Google Scholar]
- Gannon, J. S., Forbes, D. A., Romanowsky, A. J., et al. 2021, MNRAS, 510, 946 [NASA ADS] [CrossRef] [Google Scholar]
- Gnedin, O. Y., Ostriker, J. P., & Tremaine, S. 2014, ApJ, 785, 71 [Google Scholar]
- Harris, W. E., Harris, G. L. H., & Alessi, M. 2013, ApJ, 772, 82 [Google Scholar]
- Iodice, E., La Marca, A., Hilker, M., et al. 2021, A&A, 652, L11 [NASA ADS] [CrossRef] [EDP Sciences] [Google Scholar]
- Janssens, S. R., Romanowsky, A. J., Abraham, R., et al. 2022, MNRAS, 517, 858 [NASA ADS] [CrossRef] [Google Scholar]
- Jordan, A., McLaughlin, D. E., Cote, P., et al. 2007, ApJS, 171, 101 [CrossRef] [Google Scholar]
- Koda, J., Yagi, M., Yamanoi, H., & Komiyama, Y. 2015, ApJ, 807, L2 [NASA ADS] [CrossRef] [Google Scholar]
- Kolmogorov, A. N. 1933, Giornale dell’Istituto Italiano degli Attuari, 4, 83 [Google Scholar]
- Kong, D., Kaplinghat, M., Yu, H.-B., Fraternali, F., & Mancera Piña, P. E. 2022, ApJ, 936, 166 [NASA ADS] [CrossRef] [Google Scholar]
- Kruijssen, J. M. D. 2012, MNRAS, 426, 3008 [Google Scholar]
- Kruijssen, J. M. D. 2015, MNRAS, 454, 1658 [Google Scholar]
- La Marca, A., Iodice, E., Cantiello, M., et al. 2022, A&A, 665, A105 [NASA ADS] [CrossRef] [EDP Sciences] [Google Scholar]
- Lambert, M., Khim, D. J., Zaritsky, D., & Donnerstein, R. 2024, AJ, 167, 61 [NASA ADS] [CrossRef] [Google Scholar]
- Lamers, H. J. G. L. M., Gieles, M., & Portegies Zwart, S. F. 2005, A&A, 429, 173 [NASA ADS] [CrossRef] [EDP Sciences] [Google Scholar]
- Leaman, R., & Ven, G. V. D. 2021, MNRAS, 516, 4691 [NASA ADS] [CrossRef] [Google Scholar]
- Leigh, N. W. C., & Fragione, G. 2020, ApJ, 892, 32 [Google Scholar]
- Leung, G. Y. C., Leaman, R., van de Ven, G., & Battaglia, G. 2020, MNRAS, 493, 320 [Google Scholar]
- Lim, S., Peng, E. W., Côté, P., et al. 2018, ApJ, 862, 82 [Google Scholar]
- Lim, S., Côté, P., Peng, E. W., et al. 2020, ApJ, 899, 69 [CrossRef] [Google Scholar]
- Madrid, J. P., Leigh, N. W. C., Hurley, J. R., & Giersz, M. 2017, MNRAS, 470, 1729 [NASA ADS] [CrossRef] [Google Scholar]
- Martin, G., Kaviraj, S., Laigle, C., et al. 2019, MNRAS, 485, 796 [NASA ADS] [CrossRef] [Google Scholar]
- Martínez-Delgado, D., Läsker, R., Sharina, M., et al. 2016, AJ, 151, 96 [CrossRef] [Google Scholar]
- Mihos, J. C., Durrell, P. R., Ferrarese, L., et al. 2015, ApJ, 809, L21 [Google Scholar]
- Montes, M., Infante-Sainz, R., Madrigal-Aguado, A., et al. 2020, ApJ, 904, 114 [Google Scholar]
- Montes, M., Trujillo, I., Infante-Sainz, R., Monelli, M., & Borlaff, A. S. 2021, ApJ, 919, 56 [NASA ADS] [CrossRef] [Google Scholar]
- Moreno, J., Danieli, S., Bullock, J. S., et al. 2022, Nat. Astron., 6, 496 [NASA ADS] [CrossRef] [Google Scholar]
- Neumayer, N., Seth, A., & Böker, T. 2020, A&ARv, 28, 4 [Google Scholar]
- Piña, P. E. M., Aguerri, J. A. L., Peletier, R., et al. 2019, MNRAS, 485, 1036 [Google Scholar]
- Poggianti, B. M., Gullieuszik, M., Tonnesen, S., et al. 2019, MNRAS, 482, 4466 [Google Scholar]
- Pontzen, A., & Governato, F. 2012, MNRAS, 421, 3464 [NASA ADS] [CrossRef] [Google Scholar]
- Prole, D. J., van der Burg, R. F. J., Hilker, M., & Davies, J. I. 2019, MNRAS, 488, 2143 [NASA ADS] [Google Scholar]
- Prole, D. J., van der Burg, R. F. J., Hilker, M., & Spitler, L. R. 2021, MNRAS, 500, 2049 [Google Scholar]
- Prugniel, P., & Simien, F. 1997, A&A, 321, 111 [NASA ADS] [Google Scholar]
- Read, J. I., Goerdt, T., Moore, B., et al. 2006, MNRAS, 373, 1451 [NASA ADS] [CrossRef] [Google Scholar]
- Reina-Campos, M., & Kruijssen, J. M. D. 2017, MNRAS, 469, 1282 [CrossRef] [Google Scholar]
- Román, J., & Trujillo, I. 2017, MNRAS, 468, 4039 [Google Scholar]
- Saifollahi, T., Trujillo, I., Beasley, M. A., Peletier, R. F., & Knapen, J. H. 2021, MNRAS, 502, 5921 [NASA ADS] [CrossRef] [Google Scholar]
- Saifollahi, T., Zaritsky, D., Trujillo, I., et al. 2022, MNRAS, 511, 4633 [NASA ADS] [CrossRef] [Google Scholar]
- Secker, J., & Harris, W. E. 1993, AJ, 105, 1358 [Google Scholar]
- Shen, Z., van Dokkum, P., & Danieli, S. 2021, ApJ, 909, 179 [CrossRef] [Google Scholar]
- Shen, Z., van Dokkum, P., & Danieli, S. 2023, ApJ, 957, 6 [NASA ADS] [CrossRef] [Google Scholar]
- Smirnov, N. V. 1948, Ann. Math. Stat., 19, 279 [CrossRef] [Google Scholar]
- Terzić, B., & Graham, A. W. 2005, MNRAS, 362, 197 [CrossRef] [Google Scholar]
- Tremaine, S. D., Ostriker, J. P., & Spitzer, L. 1975, ApJ, 196, 407 [Google Scholar]
- Trujillo, I., Beasley, M. A., Borlaff, A., et al. 2019, MNRAS, 486, 1192 [Google Scholar]
- Trujillo-Gomez, S., Kruijssen, J. M. D., & Reina-Campos, M. 2022, MNRAS, 510, 3356 [NASA ADS] [CrossRef] [Google Scholar]
- van den Bosch, F. C., & Dattathri, S. 2026, Open J. Astrophys., 9, 57701 [Google Scholar]
- van der Burg, R. F. J., Muzzin, A., & Hoekstra, H. 2016, A&A, 590, A20 [NASA ADS] [CrossRef] [EDP Sciences] [Google Scholar]
- van der Burg, R. F. J., Hoekstra, H., Muzzin, A., et al. 2017, A&A, 607, A79 [NASA ADS] [CrossRef] [EDP Sciences] [Google Scholar]
- van Dokkum, P. G., Abraham, R., Merritt, A., et al. 2015a, ApJ, 798, L45 [NASA ADS] [CrossRef] [Google Scholar]
- van Dokkum, P. G., Romanowsky, A. J., Abraham, R., et al. 2015b, ApJ, 804, L26 [NASA ADS] [CrossRef] [Google Scholar]
- Van Dokkum, P., Abraham, R., Romanowsky, A. J., et al. 2017, ApJ, 844, L11 [NASA ADS] [CrossRef] [Google Scholar]
- van Dokkum, P., Danieli, S., Cohen, Y., et al. 2018, Nature, 555, 629 [Google Scholar]
- van Dokkum, P., Danieli, S., Abraham, R., Conroy, C., & Romanowsky, A. J. 2019, ApJ, 874, L5 [Google Scholar]
- Venhola, A., Peletier, R. F., Salo, H., et al. 2022, A&A, 662, A43 [NASA ADS] [CrossRef] [EDP Sciences] [Google Scholar]
- Villegas, D., Jordán, A., Peng, E. W., et al. 2010, ApJ, 717, 603 [Google Scholar]
- Virtanen, P., Gommers, R., Oliphant, T. E., et al. 2020, Nat. Meth., 17, 261 [Google Scholar]
- Wei, L., Huang, S., Li, J., et al. 2026, ApJ, 997, 32 [Google Scholar]
- Wolf, J., Martinez, G. D., Bullock, J. S., et al. 2010, MNRAS, 406, 1220 [NASA ADS] [Google Scholar]
- Yagi, M., Koda, J., Komiyama, Y., & Yamanoi, H. 2016, ApJS, 225, 11 [CrossRef] [Google Scholar]
- Zaritsky, D. 2022, MNRAS, 513, 2609 [NASA ADS] [CrossRef] [Google Scholar]
- Zaritsky, D., & Behroozi, P. 2022, MNRAS, 519, 871 [NASA ADS] [CrossRef] [Google Scholar]
- Zöller, R., Kluge, M., Staiger, B., & Bender, R. 2024, ApJS, 271, 52 [CrossRef] [Google Scholar]
All Tables
Kolmogorov-Smirnov (KS) test results for the three hypotheses tested when comparing the GCLF parameters of our sample with those of “normal” dwarf galaxies from Villegas et al. (2010). We reject the hypothesis when p-value < 0.05.
All Figures
|
Fig. 1. Gaussian and skew-Gaussian GCLFs for the UDGs in our sample. Solid black lines show Gaussian fits and dashed red lines show skew-Gaussian fits. For DF2 and DF4, blue and green lines denote the Gaussian and skew-Gaussian fits, respectively, assuming a distance of 20 Mpc |
| In the text | |
|
Fig. 2. Cumulative density histograms of GC spatial distributions in their respective UDGs, normalized by the effective radius, Re. For DF2 and DF4, we test two distance hypotheses, 13 and 20 Mpc, respectively. Rgc/Re values are from the literature, with * from Saifollahi et al. (2022) and ** from Janssens et al. (2022). |
| In the text | |
|
Fig. 3. Cumulative density histograms of the GC spatial distributions. The blue histogram represents DGSAT-I, the black histogram represents the stacked Coma cluster UDGs, the red histograms represent NGC1052-DF2 and the green histograms represent NGC1052-DF4, at 13 Mpc (solid line) and 20 Mpc (dashed line). |
| In the text | |
|
Fig. 4. Top panel: Enclosed mass of each UDGs as a function of radius. Middle panel: Density profile as a function of radius. Bottom panel: Velocity dispersion profile. The dots represent the measured velocity dispersions for DF2, DF4, and DGSAT-I at Re (Emsellem et al. 2019; Shen et al. 2023; Janssens et al. 2022, respectively). The color coding is as follows: DF2, black (dashed line: 13 Mpc; solid line: 20 Mpc); DF4, red (dashed line 13 Mpc; solid line 20 Mpc); DF07, blue; DF08, turquoise; DF17, green; DF44, pink; DFX1, brown; SMDG1251014, violet; and DGSAT-I, lime. |
| In the text | |
|
Fig. 5. Dynamical friction radial profiles for each UDG in the sample, assuming a GC mass of 106 M⊙. The horizontal black line corresponds to a Hubble time of ∼13.7 Gyr. The color coding is as follows: DF2, black; DF4, red; DF07, blue; DF08, turquoise; DF17, green; DF44, pink; DFX1, brown; SMDG1251014, violet; and DGSAT-I, lime. |
| In the text | |
|
Fig. 6. Dynamical friction timescales for each GCs in the UDGs as a function of galactocentric radius, normalized by the effective radius of each host galaxy. The horizontal black line represents a Hubble time of ∼13.7 Gyr. The color coding is as follows: DF2, black (dashed line: 13 Mpc; solid line: 20 Mpc); DF4, red (dashed line: 13 Mpc; solid line: 20 Mpc); DF07, blue; DF08, turquoise; DF17, green; DF44, pink; DFX1, brown; SMDG1251014, violet; and DGSAT-I, lime. * Assuming a distance of 20 Mpc instead of 13 Mpc. |
| In the text | |
|
Fig. 7. Disruption timescale profiles for each UDG in the sample, assuming GC masses of 106 M⊙ (top panel) and 104 M⊙ (bottom panel). The horizontal black line corresponds to a Hubble time of ∼13.7 Gyr. The color coding is as follows: DF2, black (dashed line: 13 Mpc; solid line: 20 Mpc); DF4, red (dashed line: 13 Mpc; solid line: 20 Mpc); DF07, blue; DF08, turquoise; DF17, green; DF44, pink; DFX1, brown; SMDG1251014, violet; and DGSAT-I, lime. |
| In the text | |
|
Fig. 8. Disruption timescales for individual GC in each UDG. The horizontal black line represents a Hubble time ∼13.7 Gyr. |
| In the text | |
|
Fig. 9. Radial distribution of GC masses as a function of galactocentric distance for Coma UDGs. Shaded gray and blue regions represent tdf < th and tdis < th, respectively. The vertical dashed red line represents Re. |
| In the text | |
|
Fig. 10. Globular cluster masses in solar units as a function of galactocentric distance (kpc) for UDGs in NGC1052. The top rows assume a distance of 13 Mpc, while the bottom rows assume 20 Mpc. Shaded black and blue regions represent tdf < th and tdis < th, respectively. The vertical dashed red line represents Re, and the dashed gray line shows rtidal for DF4 as calculated by Montes et al. (2020). |
| In the text | |
|
Fig. 11. Radial distribution of GC masses as a function of galactocentric distance for DGSAT-I. Shaded black and blue regions represent tdf < th and tdis < th, respectively. Vertical dashed red lines represent Re. |
| In the text | |
|
Fig. 12. Top panel: Average GC mass ⟨mgc⟩ as a function of dynamical mass Mdyn for the UDGs in our sample. The black line represents the best-fit relation log |
| In the text | |
Current usage metrics show cumulative count of Article Views (full-text article views including HTML views, PDF and ePub downloads, according to the available data) and Abstracts Views on Vision4Press platform.
Data correspond to usage on the plateform after 2015. The current usage metrics is available 48-96 hours after online publication and is updated daily on week days.
Initial download of the metrics may take a while.