


| Issue |
A&A
Volume 711, July 2026
Euclid Quick Data Release (Q1)
|
|
|---|---|---|
| Article Number | A41 | |
| Number of page(s) | 14 | |
| Section | Cosmology (including clusters of galaxies) | |
| DOI | https://doi.org/10.1051/0004-6361/202556233 | |
| Published online | 30 June 2026 | |
Euclid: Quick Data Release (Q1) – Watching ICM-selected galaxy clusters with Euclid eyes: Prospects of Euclid data in the context of large SZE- and X-ray-based surveys★
1
University Observatory, LMU Faculty of Physics, Scheinerstrasse 1, 81679 Munich, Germany
2
ESAC/ESA, Camino Bajo del Castillo s/n, Urb. Villafranca del Castillo, 28692 Villanueva de la Cañada, Madrid, Spain
3
Institut für Theoretische Physik, University of Heidelberg, Philosophenweg 16, 69120 Heidelberg, Germany
4
INAF-Osservatorio Astronomico di Brera, Via Brera 28, 20122 Milano, Italy
5
INAF-Osservatorio di Astrofisica e Scienza dello Spazio di Bologna, Via Piero Gobetti 93/3, 40129 Bologna, Italy
6
IFPU, Institute for Fundamental Physics of the Universe, via Beirut 2, 34151 Trieste, Italy
7
INAF-Osservatorio Astronomico di Trieste, Via G. B. Tiepolo 11, 34143 Trieste, Italy
8
INFN, Sezione di Trieste, Via Valerio 2, 34127 Trieste, TS, Italy
9
SISSA, International School for Advanced Studies, Via Bonomea 265, 34136 Trieste, TS, Italy
10
Dipartimento di Fisica e Astronomia, Università di Bologna, Via Gobetti 93/2, 40129 Bologna, Italy
11
INFN-Sezione di Bologna, Viale Berti Pichat 6/2, 40127 Bologna, Italy
12
INAF-Osservatorio Astronomico di Padova, Via dell’Osservatorio 5, 35122 Padova, Italy
13
Dipartimento di Fisica, Università di Genova, Via Dodecaneso 33, 16146 Genova, Italy
14
INFN-Sezione di Genova, Via Dodecaneso 33, 16146 Genova, Italy
15
Department of Physics “E. Pancini”, University Federico II, Via Cinthia 6, 80126 Napoli, Italy
16
INAF-Osservatorio Astronomico di Capodimonte, Via Moiariello 16, 80131 Napoli, Italy
17
Dipartimento di Fisica, Università degli Studi di Torino, Via P. Giuria 1, 10125 Torino, Italy
18
INFN-Sezione di Torino, Via P. Giuria 1, 10125 Torino, Italy
19
INAF-Osservatorio Astrofisico di Torino, Via Osservatorio 20, 10025 Pino Torinese (TO), Italy
20
European Space Agency/ESTEC, Keplerlaan 1, 2201 AZ, Noordwijk, The Netherlands
21
Institute Lorentz, Leiden University, Niels Bohrweg 2, 2333 CA, Leiden, The Netherlands
22
Leiden Observatory, Leiden University, Einsteinweg 55, 2333 CC, Leiden, The Netherlands
23
INAF-IASF Milano, Via Alfonso Corti 12, 20133 Milano, Italy
24
Centro de Investigaciones Energéticas, Medioambientales y Tecnológicas (CIEMAT), Avenida Complutense 40, 28040, Madrid, Spain
25
Port d’Informació Científica, Campus UAB, C. Albareda s/n, 08193 Bellaterra (Barcelona), Spain
26
Institute for Theoretical Particle Physics and Cosmology (TTK), RWTH Aachen University, 52056 Aachen, Germany
27
INAF-Osservatorio Astronomico di Roma, Via Frascati 33, 00078 Monteporzio Catone, Italy
28
INFN section of Naples, Via Cinthia 6, 80126 Napoli, Italy
29
Institute for Astronomy, University of Hawaii, 2680, Woodlawn Drive, Honolulu, HI 96822, USA
30
Dipartimento di Fisica e Astronomia “Augusto Righi” – Alma Mater Studiorum Università di Bologna, Viale Berti Pichat 6/2, 40127 Bologna, Italy
31
Instituto de Astrofísica de Canarias, Vía Láctea, 38205 La Laguna, Tenerife, Spain
32
Institute for Astronomy, University of Edinburgh, Royal Observatory, Blackford Hill, Edinburgh EH9 3HJ, UK
33
European Space Agency/ESRIN, Largo Galileo Galilei 1, 00044 Frascati, Roma, Italy
34
Université Claude Bernard Lyon 1, CNRS/IN2P3, IP2I Lyon, UMR 5822, Villeurbanne F-69100, France
35
Institut de Ciències del Cosmos (ICCUB), Universitat de Barcelona (IEEC-UB), Martí i Franquès 1, 08028 Barcelona, Spain
36
Institució Catalana de Recerca i Estudis Avançats (ICREA), Passeig de Lluís Companys 23, 08010 Barcelona, Spain
37
UCB Lyon 1, CNRS/IN2P3, IUF, IP2I Lyon, 4 rue Enrico Fermi, 69622 Villeurbanne, France
38
Mullard Space Science Laboratory, University College London, Holmbury St Mary, Dorking, Surrey RH5 6NT, UK
39
Departamento de Física, Faculdade de Ciências, Universidade de Lisboa, Edifício C8, Campo Grande, PT1749-016 Lisboa, Portugal
40
Instituto de Astrofísica e Ciências do Espaço, Faculdade de Ciências, Universidade de Lisboa, Campo Grande, 1749-016 Lisboa, Portugal
41
Department of Astronomy, University of Geneva, ch. d’Ecogia 16, 1290 Versoix, Switzerland
42
Université Paris-Saclay, CNRS, Institut d’astrophysique spatiale, 91405 Orsay, France
43
Aix-Marseille Université, CNRS, CNES, LAM, Marseille, France
44
INFN-Padova, Via Marzolo 8, 35131 Padova, Italy
45
INAF-Istituto di Astrofisica e Planetologia Spaziali, via del Fosso del Cavaliere 100, 00100 Roma, Italy
46
Space Science Data Center, Italian Space Agency, via del Politecnico snc, 00133 Roma, Italy
47
INFN-Bologna, Via Irnerio 46, 40126 Bologna, Italy
48
Max Planck Institute for Extraterrestrial Physics, Giessenbachstr. 1, 85748 Garching, Germany
49
Universitäts-Sternwarte München, Fakultät für Physik, Ludwig-Maximilians-Universität München, Scheinerstrasse 1, 81679 München, Germany
50
Institute of Theoretical Astrophysics, University of Oslo, P.O. Box 1029 Blindern 0315, Oslo, Norway
51
Jet Propulsion Laboratory, California Institute of Technology, 4800, Oak Grove Drive, Pasadena, CA 91109, USA
52
Department of Physics, Lancaster University, Lancaster LA1 4YB, UK
53
Felix Hormuth Engineering, Goethestr. 17, 69181 Leimen, Germany
54
Technical University of Denmark, Elektrovej 327, 2800 Kgs, Lyngby, Denmark
55
Cosmic Dawn Center (DAWN), Denmark
56
Max-Planck-Institut für Astronomie, Königstuhl 17, 69117 Heidelberg, Germany
57
NASA Goddard Space Flight Center, Greenbelt, MD 20771, USA
58
Department of Physics and Helsinki Institute of Physics, Gustaf Hällströmin katu 2, 00014 University of Helsinki, Helsinki, Finland
59
Aix-Marseille Université, CNRS/IN2P3, CPPM, Marseille, France
60
Université de Genève, Département de Physique Théorique and Centre for Astroparticle Physics, 24 quai Ernest-Ansermet, CH-1211 Genève 4, Switzerland
61
Department of Physics, P.O. Box 64, 00014 University of Helsinki, Helsinki, Finland
62
Helsinki Institute of Physics, Gustaf Hällströmin katu 2, University of Helsinki, Helsinki, Finland
63
Laboratoire d’etude de l’Univers et des phenomenes eXtremes, Observatoire de Paris, Université PSL, Sorbonne Université, CNRS, 92190 Meudon, France
64
SKA Observatory, Jodrell Bank, Lower Withington, Macclesfield, Cheshire SK11 9FT, UK
65
Centre de Calcul de l’IN2P3/CNRS, 21 avenue Pierre de Coubertin, 69627 Villeurbanne Cedex, France
66
Dipartimento di Fisica “Aldo Pontremoli”, Università degli Studi di Milano, Via Celoria 16, 20133 Milano, Italy
67
INFN-Sezione di Milano, Via Celoria 16, 20133 Milano, Italy
68
Universität Bonn, Argelander-Institut für Astronomie, Auf dem Hügel 71, 53121 Bonn, Germany
69
INFN-Sezione di Roma, Piazzale Aldo Moro, 2 – c/o Dipartimento di Fisica, Edificio G. Marconi, 00185 Roma, Italy
70
Dipartimento di Fisica e Astronomia “Augusto Righi” – Alma Mater Studiorum Università di Bologna, via Piero Gobetti 93/2, 40129 Bologna, Italy
71
Department of Physics, Institute for Computational Cosmology, Durham University, South Road, Durham DH1 3LE, UK
72
Université Côte d’Azur, Observatoire de la Côte d’Azur, CNRS, Laboratoire Lagrange, Bd de l’Observatoire, CS 34229, 06304 Nice cedex 4, France
73
Université Paris Cité, CNRS, Astroparticule et Cosmologie, 75013 Paris, France
74
CNRS-UCB International Research Laboratory, Centre Pierre Binétruy, IRL2007, CPB-IN2P3, Berkeley, USA
75
Institut d’Astrophysique de Paris, 98bis Boulevard Arago, 75014 Paris, France
76
Institut d’Astrophysique de Paris, UMR 7095, CNRS, and Sorbonne Université, 98 bis boulevard Arago, 75014 Paris, France
77
Institute of Physics, Laboratory of Astrophysics, Ecole Polytechnique Fédérale de Lausanne (EPFL), Observatoire de Sauverny, 1290 Versoix, Switzerland
78
Institut de Física d’Altes Energies (IFAE), The Barcelona Institute of Science and Technology, Campus UAB, 08193 Bellaterra (Barcelona), Spain
79
DARK, Niels Bohr Institute, University of Copenhagen, Jagtvej 155, 2200 Copenhagen, Denmark
80
Waterloo Centre for Astrophysics, University of Waterloo, Waterloo, Ontario N2L 3G1, Canada
81
Department of Physics and Astronomy, University of Waterloo, Waterloo, Ontario N2L 3G1, Canada
82
Perimeter Institute for Theoretical Physics, Waterloo, Ontario N2L 2Y5, Canada
83
Université Paris-Saclay, Université Paris Cité, CEA, CNRS, AIM, 91191 Gif-sur-Yvette, France
84
Centre National d’Etudes Spatiales – Centre spatial de Toulouse, 18 avenue Edouard Belin, 31401 Toulouse Cedex 9, France
85
Institute of Space Science, Str. Atomistilor, nr. 409 Măgurele, Ilfov 077125, Romania
86
Consejo Superior de Investigaciones Cientificas, Calle Serrano 117, 28006 Madrid, Spain
87
Universidad de La Laguna, Departamento de Astrofísica, 38206 La Laguna, Tenerife, Spain
88
Dipartimento di Fisica e Astronomia “G. Galilei”, Università di Padova, Via Marzolo 8, 35131 Padova, Italy
89
Institut de Recherche en Astrophysique et Planétologie (IRAP), Université de Toulouse, CNRS, UPS, CNES, 14 Av. Edouard Belin, 31400 Toulouse, France
90
Université St Joseph; Faculty of Sciences, Beirut, Lebanon
91
Departamento de Física, FCFM, Universidad de Chile, Blanco Encalada, 2008, Santiago, Chile
92
Universität Innsbruck, Institut für Astro- und Teilchenphysik, Technikerstr. 25/8, 6020 Innsbruck, Austria
93
Institut d’Estudis Espacials de Catalunya (IEEC), Edifici RDIT, Campus UPC, 08860 Castelldefels, Barcelona, Spain
94
Satlantis, University Science Park, Sede Bld, 48940 Leioa-Bilbao, Spain
95
Institute of Space Sciences (ICE, CSIC), Campus UAB, Carrer de Can Magrans s/n, 08193 Barcelona, Spain
96
Instituto de Astrofísica e Ciências do Espaço, Faculdade de Ciências, Universidade de Lisboa, Tapada da Ajuda, 1349-018, Lisboa, Portugal
97
Cosmic Dawn Center (DAWN)
98
Niels Bohr Institute, University of Copenhagen, Jagtvej 128, 2200 Copenhagen, Denmark
99
Universidad Politécnica de Cartagena, Departamento de Electrónica y Tecnología de Computadoras, Plaza del Hospital 1, 30202 Cartagena, Spain
100
Infrared Processing and Analysis Center, California Institute of Technology, Pasadena, CA 91125, USA
101
INAF, Istituto di Radioastronomia, Via Piero Gobetti 101, 40129 Bologna, Italy
102
ICL, Junia, Université Catholique de Lille, LITL, 59000 Lille, France
103
ICSC – Centro Nazionale di Ricerca in High Performance Computing, Big Data e Quantum Computing, Via Magnanelli 2, Bologna, Italy
★★ Corresponding author: This email address is being protected from spambots. You need JavaScript enabled to view it.
Received:
3
July
2025
Accepted:
1
February
2026
Abstract
Galaxy clusters detected through their X-ray emission or Sunyaev–Zeldovich effect (SZE), both produced by the intracluster medium (ICM), have been successfully used in cosmological and astrophysical studies. To maximise the scientific return and robustness of such studies, complementary information from other datasets is required. Systematic cluster confirmation and redshifts of ICM-selected cluster candidates are typically provided by wide-field optical and infrared imaging surveys, which are becoming increasingly challenged by ongoing ICM-selected samples. Particularly at high redshifts (z > 1) reached by future SZE-selected samples, current large surveys may not be sufficient for this task. Deep high-resolution infrared surveys, such as those conducted with Euclid, are therefore essential to confirm the majority of high-redshift clusters in these future samples. In this context, we present an analysis of the first sizeable Euclid dataset (Q1), which overlaps with several ICM-selected cluster samples. We applied an adaptation of the MCMF cluster redshift and confirmation tool to Euclid data to estimate key cluster properties, including redshift and richness, and to predict its capabilities to confirm high-redshift galaxy clusters. We find promising performance in redshift and richness estimation, particularly at high redshift. The performance in richness estimation at low redshifts (z < 0.4) is currently impacted by limitations of the Q1 dataset and are likely to improve in future data releases. By comparing MCMF measurements along random lines of sight with similar measurements from the SZE-based ACT-DR5 MCMF catalogue, we predict that the ability to confirm clusters at 1 < z < 2 using Euclid will be comparable to that of current large optical surveys at z < 0.6 and will significantly enhance the capability of cluster confirmation at high redshifts. SZE-selected cluster samples will therefore especially benefit from overlap with Euclid datasets. Through study of the five known high-z SZE-selected clusters in Q1, we identified the highest-redshift jellyfish galaxy candidate found to date in an ICM-selected cluster. This galaxy, EUCL J035330.86−504347.6, is located in the massive cluster SPT-CL J0353−5043 at z = 1.32. We also found two massive star-forming galaxies projected close to the core of ACT-CL J0350.0−4819 (z ≃ 1.46) and evidence of strong lensing features in SPT-CL J0353−5043 and SPT-CL J0421−4845.
Key words: surveys / galaxies: clusters: general / galaxies: clusters: intracluster medium / galaxies: star formation / cosmology: observations
This paper is published on behalf of the Euclid Consortium.
© The Authors 2026
 Open Access article, published by EDP Sciences, under the terms of the Creative Commons Attribution License (https://creativecommons.org/licenses/by/4.0), which permits unrestricted use, distribution, and reproduction in any medium, provided the original work is properly cited.
This article is published in open access under the Subscribe to Open model. This email address is being protected from spambots. You need JavaScript enabled to view it. to support open access publication.
1. Introduction
Galaxy cluster samples constructed through X-ray observations or the Sunyaev–Zeldovich effect (SZE; Sunyaev & Zeldovich 1972) signal constitute a special subclass of cluster samples, as their detection observables are based on the properties of the intracluster medium (ICM). They have successfully been used to derive constraints on cosmological parameters, such as σ8, Ωm, and the dark energy equation of state parameter w (Mantz et al. 2015; Planck Collaboration XXIV 2016; Chiu et al. 2023; Bocquet et al. 2024; Ghirardini et al. 2024). ICM-selected cluster samples have also been used to study non-standard cosmology (Vogt et al. 2025; Mazoun et al. 2025; Artis et al. 2024) and to constrain the Hubble parameter (Kozmanyan et al. 2019; Gonzalez et al. 2024).
The sizes of galaxy cluster samples constructed through their X-ray or SZE signature have increased by more than a factor of ten over the past decade, ranging from a few hundred confirmed clusters (Bleem et al. 2015; Böhringer et al. 2013; Planck Collaboration XXXII 2015) to now several thousands of ICM-selected clusters (Finoguenov et al. 2020; Klein et al. 2023; Bulbul et al. 2024; Hilton et al. 2021; Klein et al. 2024b; Aguena et al. 2026). The availability of high-quality optical and infrared survey data, such as from the Dark Energy Survey (DES; Abbott et al. 2016), Sloan Digital Sky Survey (SDSS; York et al. 2000), and WISE (Wright et al. 2010), has further enhanced the characterisation of these clusters. Recent efforts have combined ICM-based selection with systematic optical follow-up using multi-band surveys (Klein et al. 2019; Finoguenov et al. 2020; Bleem et al. 2020), improving sample purity and completeness while extending cluster samples to lower masses and higher redshifts. The ongoing and future generation of SZE-based surveys such as SPT-3G (Benson et al. 2014), the Simons Observatory (SO; Ade et al. 2019), and CMB-S4 (Abazajian et al. 2022) will significantly expand current ICM-based cluster samples in the high-redshift regime, significantly challenging current ground- and space-based optical and infrared surveys. Although the upcoming Legacy Survey of Space and Time (LSST; Ivezić et al. 2019) conducted at the Vera C. Rubin Observatory will significantly add depth compared to currently available datasets, its lack of infrared data will not allow for precise redshift estimates of the high-redshift galaxy clusters expected from the SZE-based surveys. In this context, the Euclid mission (Euclid Collaboration: Mellier et al. 2025) is of key importance, with its unique combination of survey area, imaging quality, and depth in the infrared regime. The Euclid mission itself is expected to provide ∼105 galaxy clusters selected from its optical and infrared imaging (Euclid Collaboration: Adam et al. 2019), with the potential to provide stringent cosmological constraints (Sartoris et al. 2016) if systematics on the selection function and mass calibration are kept under control. The first detections from the Euclid galaxy cluster workflow using the Q1 dataset have been presented in Euclid Collaboration: Bhargava et al. (2026).
To investigate the prospects of Euclid data to estimate redshifts and confirm ICM-selected clusters, we used the multi-component matched filter (MCMF) method (Klein et al. 2018, 2019), which has been successfully applied to numerous catalogues of cluster candidates from various X-ray and SZE missions and telescopes such as ROSAT (Trümper 1993), SPT (Carlstrom et al. 2011), ACT (Fowler et al. 2007), Planck (Planck Collaboration I 2011), and eROSITA (Predehl et al. 2021). In this study, we apply the MCMF method on the existing ICM-selected cluster catalogues RASS-MCMF (Klein et al. 2023), SPT-SZ MCMF (Klein et al. 2024a), ACT-DR5 MCMF (Klein et al. 2024b), and eROSITA eRASS1 (Bulbul et al. 2024) with the goal of evaluating and leveraging new optical and near-infrared data from the Euclid survey. Euclid’s unprecedented imaging depth and homogeneous coverage provide an opportunity to improve photometric redshift estimates and identify high-redshift clusters that were previously inaccessible with ground-based optical surveys. This analysis aims to evaluate the advantages of Euclid data in improving cluster characterisation, particularly at high redshifts, and to assess the potential systematics affecting data quality. To do so and in contrast to previous work on creating MCMF-confirmed cluster catalogues (e.g. Klein et al. 2019, 2022; Hernández-Lang et al. 2023), we ran MCMF on already confirmed systems and evaluated key observables such as cluster richness (λ) and cluster photometric redshifts (z) of those systems. The quality of the richness measurements, combined with MCMF runs along random lines of sight, will enable an assessment of Euclid’s ability to confirm high-redshift ICM-selected clusters. As the main focus of this work is on the high-redshift (z > 1) clusters of these samples, we further investigate and discuss the imaging and photometric data of the known high-redshift clusters in the ICM-selected samples to highlight the Euclid capabilities and inspire future studies of those systems.
This paper is structured as follows. In Sect. 2, we describe the datasets used in this analysis. Section 3 presents the methods, the adaptation of MCMF to the Euclid data, and current limitations. In Sect. 4, we present results of running MCMF on Euclid data from redshifts and richness in Sect. 4.1, the forecast on cluster confirmation in Sect. 4.2 and individual discussions on high-redshift clusters in Sect. 4.3. The paper closes with conclusions and an outlook on the future Euclid DR1 dataset in Sect. 5. Throughout this paper we adopt a flat Λ cold dark matter (ΛCDM) cosmology with Ωm = 0.3 and H0 = 70 km s−1 Mpc−1.
2. Datasets
The survey fields contained in the Euclid Q1 data release overlap with a huge number of optical and ICM-based cluster samples because of their location within the SDSS or DES optical surveys and their relative proximity to the northern or southern ecliptic poles. Therefore, we needed to select a subset of cluster catalogues.. In this work, we limit the set of cluster samples to the two largest X-ray catalogues to date, RASS-MCMF (Klein et al. 2023) and the eROSITA eRASS1 cluster catalogue (Bulbul et al. 2024), as well as the largest SZE-selected cluster catalogue (ACT-DR5 MCMF; Klein et al. 2024b) and the SZE catalogue with the highest number of high-z SZE-detected clusters in Q1 (SPT-SZ MCMF; Klein et al. 2024a). A further advantage of these surveys is the similarity in their optical follow-up, as they all use a red sequence-based technique together with imaging and photometric data from the Dark Energy Camera (DECam; Flaugher et al. 2015) to confirm galaxy clusters.
2.1. The Euclid Q1 dataset
The Euclid Q1 release encompasses three fields, corresponding to the Euclid Deep Field North (EDF-N), the Euclid Deep Field South (EDF-S), and the Euclid Deep Field Fornax (EDF-F). The three fields have sizes of approximately 23 deg2, 28 deg2, and 12 deg2, and the depth of the fields corresponds to that expected for the Euclid Wide Survey. As EDF-N does not overlap with deep SZE surveys or with the eROSITA eRASS1 survey and also differs in ground-based external photometry, we decided not to consider EDF-N for this study. The remaining two fields share the same g, r, i, z-band external imaging data from the DECam, with most of the contributing observations coming from DES. This causes the two fields to have very similar imaging quality in Euclid- and ground-based datasets. The data products and an overview of the Q1 data release can be found in Euclid Collaboration: Aussel et al. (2026) and Euclid Quick Release Q1 (2025), and more details on the data processing of the VIS, NISP instruments, and the external (EXT) datasets can be found in dedicated papers from Euclid Collaboration: McCracken et al. (2026), Euclid Collaboration: Polenta et al. (2026), and Euclid Collaboration: Romelli et al. (2026), respectively. We have therefore limited the discussion of the Q1 dataset to the most relevant details and refer the reader to the aforementioned publications.
The Euclid VIS instrument (Euclid Collaboration: Cropper et al. 2025) observes the sky in a single band, IE, ranging from 530 to 920 nm with an imaging resolution of  full width at half maximum. The VIS data are used for optical investigation, as well as for star-galaxy separation and flagging. The Near-Infrared Spectrometer and Photometer instrument (NISP; Euclid Collaboration: Jahnke et al. 2025) provides imaging in the three near-infrared bands YE, JE, and HE. The 5σ imaging depths are 26.0, 23.9, 24.1, and 24.0 for IE, YE, JE, and HE, respectively (Euclid Collaboration: Romelli et al. 2026). Using the red-sequence models entering MCMF, the cited imaging depths are sufficient to detect galaxies of luminosities of m* + 2 out to redshifts of z ≈ 1.7. Incompleteness within the galaxy sample therefore has a negligible effect on confirming clusters throughout the studied redshift range (z < 1.5).
2.2. X-ray surveys
The X-ray emission is proportional to the square of the electron density in the ICM and is therefore well suited to detectecting galaxy clusters without suffering projection effects caused by non-collapsed structures. The observed X-ray flux further depends on the inverse square of the luminosity distance, which causes the X-ray-selected cluster samples to have a selection function that is strongly redshift dependent. For this reason, the X-ray-selected cluster samples preferentially probe the low-redshift and low-mass regime and therefore can be seen as the low-redshift anchor for this study.
2.2.1. RASS-MCMF
The RASS-MCMF cluster catalogue (Klein et al. 2023) covers ∼25 000 deg2 outside the galactic plane (|b|> 17 deg). The ROSAT (Trümper 1993) X-ray-based RASS-MCMF catalogue contains 8449 clusters and has a purity of 90% and is extracted from the second ROSAT all-sky survey source catalogue (2RXS; Boller et al. 2016). The catalogue creation closely followed the work on the predecessor catalogue MARD-Y3 (Klein et al. 2019) and uses the MCMF cluster confirmation tool described in Klein et al. (2018, 2019) together with DESI Legacy Survey DR10 optical imaging and photometric data (Dey et al. 2019). In contrast to other X-ray surveys, RASS-MCMF does not impose any cuts on the apparent size of the X-ray emission. It uses advanced statistical techniques to control and measure sample purity using optical cluster richness.
2.2.2. eROSITA eRASS1
The eROSITA (Predehl et al. 2021) X-ray telescope is the successor of the ROSAT telescope, with increased image resolution and sensitivity. The telescope observed the whole sky more than four times (Coutinho et al. 2022) until it was placed in safe mode due to the Russian invasion of Ukraine on 28 February 2022. The German eROSITA Consortium recently publicly released data and source catalogues of the first all-sky scan (Merloni et al. 2024) that covers the entire western Galactic hemisphere. Part of this release is the eROSITA eRASS1 catalogue of galaxies and groups covering an area of 12 791 deg2 and containing 12 247 optically confirmed clusters and groups with an expected purity of 86%. The sample was constructed by imposing a cut on the X-ray extent likelihood of Lext > 3 and requiring the presence of an overdensity of red sequence galaxies in addition to the X-ray source detection.
2.3. SZE surveys
The strength of the SZE signal depends on the line-of-sight integral of the electron pressure of the ICM, and similar to X-ray observations, SZE surveys are less prone to projection effects than other cluster probes, such as optical or weak gravitational lensing-based studies. The SZE effect is redshift independent, which makes samples such as those used in this work have an approximately flat selection function with redshift. However, the SZE surveys used in this work suffer from atmospheric effects and the signal from the primary cosmic microwave background, causing them to lose sensitivity at low redshift when angular sizes of clusters approach sizes of the primary CMB. The SZE surveys used in this work preferentially probe redshifts of 0.2 < z < 2. The SZE surveys therefore play a key role in this work in testing the performance of the Euclid dataset at high redshift.
2.3.1. SPT-SZ MCMF
The SPT-SZ survey was conducted between 2007 and 2011 with the SPT-SZ camera on the South Pole Telescope (SPT; Carlstrom et al. 2011) covering ∼2500 deg2. The first SPT-SZ cluster catalogue covering the full footprint contained 677 cluster candidates and 516 confirmed clusters above a signal-to-noise (S/N) threshold of 4.5 was presented in Bleem et al. (2015). The SPT-SZ MCMF catalogue (Klein et al. 2024a) is based on this dataset and is the result of systematic optical and infrared follow-up of all candidates with S/N > 4 using homogeneous imaging data from DES and WISE (Wright et al. 2010; Schlafly et al. 2019). Homogeneous follow-up, together with confirmation through the MCMF confirmation tool, allowed for an increased cluster sample of 811 clusters with a measured purity of 91%. The completeness with respect to pure SZE selection is estimated to be 95%. For homogeneity reasons, the SPT-SZ MCMF catalogue does not incorporate individual pointed observations, such as those in the infrared regime from the Spitzer telescope (Fazio et al. 2004).
2.3.2. ACT-DR5 MCMF
The ACT-DR5 MCMF catalogue (Klein et al. 2024b) is based on data from the fifth data release (Naess et al. 2020) from the Atacama Cosmology Telescope (Fowler et al. 2007). Using homogeneous optical follow-up from the DESI Legacy Survey DR10 (Dey et al. 2019) and the most recent WISE imaging data together with the MCMF cluster confirmation tool over a total area of ∼13 000 deg2. Compared to its predecessor catalogue (Hilton et al. 2021), the SZE-detection run was modified to ensure an unbiased selection at a signal-to-noise ratio of S/N = 4 and the more complete and systematic confirmation resulted in a significantly increased cluster sample with a higher completeness at high redshift. The total sample has 6247 clusters with an estimated purity of 89.3%.
3. Methods
The MCMF cluster confirmation tool was developed in Klein et al. (2018) and refined in Klein et al. (2019) to confirm ICM-selected cluster candidates from large surveys. It was used to construct X-ray-selected and optically confirmed galaxy cluster catalogues from the ROSAT survey (Klein et al. 2018, 2019, 2023) and eROSITA (Klein et al. 2022). It was further used to create SZE-based galaxy cluster catalogues from Planck (Hernández-Lang et al. 2023), SPT (Klein et al. 2024a; Bleem et al. 2024), and ACT (Klein et al. 2024b). In addition to other work, MCMF-based catalogues were successfully used to derive cosmological constraints using weak gravitational lensing calibrated cluster number counts analysis (Chiu et al. 2023; Bocquet et al. 2024; Vogt et al. 2025; Mazoun et al. 2025).
In this work, we adopt the MCMF tool to the Q1 dataset to predict the ability of Euclid data to confirm ICM-selected cluster candidates as real clusters. A further aim of this work is to probe the quality of the published ICM-selected samples at high redshift. We measure key properties of the clusters, namely the cluster redshift and the cluster richness λ for the samples listed above of known clusters and compare them to published measurements to get an estimate of the performance of the Euclid data on those properties. In a second step, we run MCMF towards random lines of sight and compare those measurements with our previous work using other imaging surveys, such as the DESI Legacy Survey (LSDR10; Dey et al. 2019) and unWISE (Schlafly et al. 2019). In Fig. 1 we show three colour composite images of the cluster ACT-CL J0350.0−4819 using LSDR10, unWISE, and Euclid to provide the reader a visual comparison of the data previously used for cluster confirmation and what is now available through Euclid imaging data.
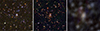 |
Fig. 1. Colour composite images of a |

3.1. MCMF on Euclid
The MCMF algorithm incorporates a red sequence technique (Gladders & Yee 2000; Rykoff et al. 2014) that simultaneously uses redshift- and magnitude-dependent colour filters in the optical and infrared bands, such as g − r, r − i, i − z, and z − w1 in the case of LSDR10. Galaxies are further weighted according to their projected distance to the ICM-based centre and are only considered within a projected distance of r500. Here r500 is the radius within which the mean density is 500 times the critical density of the Universe at a given redshift, and it is derived from the expected mass M500 of a cluster candidate given redshift and ICM-based mass observable.
The code calculates richness in fine redshift steps along the cluster candidate line of sight and searches for peaks in the distribution, corresponding to possible optical counterparts to the ICM-selected cluster. An example of such a measurement is shown in Fig. 2 towards the high-z galaxy cluster ACT-CL J0350.0−4819 at z ∼ 1.46. We refer the interested reader to previous MCMF related papers (e.g. Klein et al. 2018, 2019) for a more detailed description on the richness and redshift measurements of MCMF. In the following subsection, we restrict the discussion to the modifications performed with respect to our latest work (Klein et al. 2024b).
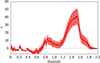 |
Fig. 2. The λ–z plot along the line of sight of ACT-CL J0350.0−4819, the cluster with the highest redshift measured in the sample. |
For this work we reuse the red sequence models in the g − r, r − i, i − z colours from previous MCMF work using LSDR10 data, which used the same DECam imaging data as those used in Q1 (Klein et al. 2019, 2023). We match Euclid Q1 galaxies with the DECam-based LSDR10 catalogue within one arcsecond to measure possible systematic differences in observed galaxy colours. We find only small (< 0.025 mag) shifts that we account for in the subsequent analysis.
The small area of Q1 does not include a sufficient number of galaxy clusters with known spectroscopic redshifts that would allow direct self-calibration at high redshifts. We therefore calibrate the Euclid-related red sequence colours (z − YE, YE − JE, JE − HE) using the COSMOS photo-z catalogue (Weaver et al. 2022), which provides high-quality photo-z out to the highest redshifts explored in this work (z = 2). We apply a cut in the specific star-formation rate (< 10−12 yr−1) and stellar mass (> 1011 M⊙) to preselect passive galaxies in the relevant mass range and further add 363 spectroscopically confirmed cluster members in the Q1 fields to increase the sample of galaxies at z < 0.1. To check if the calibration the red sequence colours are reasonable, we run MCMF in different configurations omitting some of the bands. We find that redshifts remain consistent even in the case of dropping g − r and r − i colours, hence putting more weight to the remaining Euclid-based bands. More details and figures comparing different redshift estimates can be found in Appendix A.
While testing redshift recovery predominantly probes the agreement between predicted and observed red sequence colour, testing the recovered richness probes the model of the scatter of galaxies around the red sequence and with that the photometry. In doing so, we found that the richness is not reasonably well recovered when different bands are omitted in the richness estimate. In fact, adding ground-based g- and r-band observations causes the richness to be significantly underestimated at low redshifts (z < 0.5). Exploring the reasons for this, we identified at least two issues that impact the richness at low redshifts. We first identified that the scatter of the red sequence colour is significantly higher than that found in LSDR10, for the same DECam imaging data. In this context, we tested multiple types of photometry available in Q1 (Euclid Collaboration: Romelli et al. 2026) and their scatter in colour with respect to LSDR10 colours. We found that the template fitting-based photometry (TEMPLFIT) provides the lowest scatter for red sequence-like galaxies compared to the other photometry provided in the Q1 catalogue, but still yielding significantly higher scatter than LSDR10 photometry. We account for this fact by increasing the intrinsic scatter of the red sequence by a factor of two in our models.
The second issue is related to flux measurements for bright but compact galaxies between 17 and 21 magnitudes in the YE band. The current Euclid processing is not optimised for those sources, and cores of those galaxies are masked and not properly processed. As a result ∼20% of the galaxies in that magnitude range around clusters show huge offsets in at least one of the colours at levels of ∼0.5 magnitudes in TEMPLFIT-based measurements. More details on known issues with the Q1 data can be found in the Q1 Explanatory Supplement1. These offsets correspond to several sigma in terms of total expected scatter of the red sequence galaxies. Galaxies affected by this issue are heavily down-weighted in the richness estimate as they appear not to be consistent with the red sequence at the cluster redshift, and hence the richness is biased low. Exploring other types of photometry, we found that the Q1 aperture photometry is affected by the same issue, while the Sérsic profile-based photometry appears significantly less affected. We therefore use Sérsic profile-based photometry measurements to replace TEMPLFIT-based colours in g, r, i, z-bands in cases where colours deviate more than 0.2 magnitudes from each other. While this reduces the impact of this issue on the richness estimate, it does not completely resolve the problem. As a way to mitigate this problem, we therefore decided to use the full set of colours for redshift estimates while ignoring the g − r and r − i colours for the richness estimate to avoid too strong biases in the low-redshift regime. We remind the reader that the main focus of the paper is predominantly in the z > 1 regime, where ground-based imaging data lose their constraining power and the photometry of bright sources in the g, r, i, z-bands is not of relevance.
MCMF typically performs model fits to the peaks found in the λ versus z measurement (see Fig. 2) towards each candidate position. The used peak models are generally based on a large set of clusters with spectroscopic redshifts. This allows for improved redshift and richness estimates by accounting for the expected shape of a peaks, as well as it provides the ability to de-blend structures in redshift space. They further provide an in-build calibration to spectroscopic redshifts ensuring unbiased cluster redshifts.
As the Q1 fields are too small to construct reliable peak models, we decided to quote redshifts and richnesses based on the peaks identified in the λ versus z measurements and do not quote uncertainties on those measurements. The addition of the Euclid NIR bands ensures better behaved peak shapes at high redshift, reducing the need for performing model fits to the data. De-blending in redshift space is only relevant for less than 2% of the cluster sample and will not be of high importance for this work either. The first main data release (DR1) will incorporate improvements on the issues found in Q1 and provide sufficient area to perform self-calibration of red sequence and peak models, as it was done in previous work.
3.2. MCMF towards random lines of sight
MCMF employs the redshift and richness distributions derived from random lines of sight, alongside those of the actual ICM-selected candidates, to distinguish genuine clusters from false detections. The redshifts and richnesses of these random lines of sight are assumed to represent the background population of false positives within the ICM-selected candidate list. To best approximate this contaminating population, it is necessary to account for the fact that MCMF uses an ICM-based mass proxy to estimate richness, and that the survey data themselves contain real ICM-selected clusters. Consequently, the appropriate configuration of these so-called randoms depends on the survey from which the ICM-selected candidates originate.
Given the focus of this work on assessing Euclid’s performance at high redshift, we generated randoms following the characteristics of the SZE-based ACT-DR5 MCMF catalogue. Specifically, we constructed a set of randoms that exhibit a signal-to-noise distribution that follows the expected distribution of contaminants in ACT-DR5. The SZE-based samples from SPT and ACT are based on observations in the 90 GHz and 150 GHz bands, where the SZE-signal is negative while other astrophysical sources only cause positive signals. As a result, such SZE-based samples exhibit contamination that follows a signal-to-noise distribution expected for Gaussian noise. For the ACT-DR5 MCMF catalogue it was shown that a Gaussian noise model with a standard deviation of σ = 1.146 can describe the signal-to-noise distribution of contaminants over four orders of magnitude Klein et al. (2024b). We adopt this measurement to create the signal-to-noise distribution for the randoms, which were then randomly distributed over the footprint, excluding regions closer than 5 arcmin to confirmed ACT-DR5 clusters.
This approach should be applicable to other deep SZE-based surveys as well. For even deeper SZE surveys, we expect the richness measured along random lines of sight to decrease. This is due to the fact that the expected mass at fixed SZE signal-to-noise becomes smaller, which in turn reduces the aperture size (r500) used by MCMF to compute richness. Additionally, more randoms that by chance fall near real clusters are excluded, as these clusters now exceed the detection threshold of the given survey. In total, we ran MCMF on approximately 5000 random positions within Q1. In Fig. 3 we show the redshift and richness measurements of the randoms in direct comparison to similar WISE-based MCMF randoms for the z > 1 range. The Euclid-MCMF measurements show lower richnesses, suggesting that the noise due to non-collapsed or low-mass systems is significantly smaller when compared to WISE-based measurements. The precise impact on cluster confirmation is discussed in Sect. 4.2.
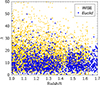 |
Fig. 3. Comparison of the richness distribution along random lines of sight as a function of redshift using either WISE-based or Euclid-based MCMF measurements. No strong redshift evolution is visible for Euclid-based MCMF measurements. The lower scatter for Euclid-based MCMF suggests lower noise and hence improved separation of real clusters from contaminants. |
4. Results
4.1. Redshift and richness
MCMF was run without fitting peak profiles to the richness-versus-redshift distributions along the candidate lines of sight. This results in a slight reduction in performance and introduces the possibility of small biases between the true and inferred redshifts. Furthermore, it prevents de-blending of multiple structures along the line of sight. The performance of MCMF on Euclid data is therefore expected to improve further as the survey progresses and sufficient area for self-calibration becomes available. Combining the ACT-DR5 MCMF, SPT-SZ MCMF, RASS-MCMF, and eRASS1 samples, we measure on average a 3% over estimation of the Euclid-MCMF photo-z with respect to the redshifts published in those cluster catalogues. Assuming that the ensemble of catalogues exhibits negligible bias with respect to the true cluster redshift, we correct for this 3% bias by multiplying the Euclid-MCMF photo-z by 0.97.
The left panel of Fig. 4 compares the Euclid-MCMF photo-z with published measurements. As shown in the plot, we generally find good agreement between the published and Euclid-MCMF results. We identify 1eRASS J040527.1−490347, marked as a grey square in Fig. 4, as having a significantly different redshift. This cluster, together with the five clusters with published redshifts greater than one, is discussed in more detail in Sect. 4.3. The cluster with the highest published redshift, SPT-CL J0421−4845, shows a ∼2.1σ deviation from the Euclid-MCMF estimate. This deviation is likely due to a bright point source affecting the WISE-based redshift estimate reported in the SPT-SZ MCMF catalogue. This cluster also has deep HST and Spitzer imaging data, with an improved redshift estimate of z = 1.38 ± 0.02 (Strazzullo et al. 2019), and is shown as a yellow square in Fig. 4. As stated in Sect. 2, all datasets make use of DECam imaging data. This may cause some correlation in the photo-z estimates between those catalogues and the Euclid-based measurements, especially at low redshift. At z > 1 the infrared datasets gain more relevance, reducing any remaining correlation between measurements.
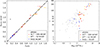 |
Fig. 4. Left: Recovery of published redshifts with Euclid-MCMF. Redshifts of 1eRASS J040527.1−490347 (grey square) and SPT-CL J0421−4845 (yellow square) are discussed in greater detail in Sect. 4.3. Right: Euclid-MCMF richness (λ) versus ICM-based mass estimates (M500). |
In the right panel of Fig. 4, we show the Euclid-MCMF richness as a function of ICM-based masses from the four cluster samples analysed in this work. To ensure approximate comparability between masses from different surveys, we use the overlap of the full cluster catalogues (not limited to the Q1 field) to derive simple scaling factors. We use the mass estimates M500CAL from the ACT-DR5 MCMF (Klein et al. 2024b) as reference, as it has the largest overlap between all catalogues. As outlined in greater detail in Hilton et al. (2021), the M500CAL measurements include a scale factor, derived from a weak lensing calibrated richness-mass relation, to correct for a mass bias in the default ACT-based masses. As seen in Fig. 4, the Euclid-MCMF richness correlates strongly with ICM-based mass estimates. In Appendix A we further compare Euclid-MCMF richness with the measurements provided in ACT-DR5 MCMF and SPT-SZ MCMF.
We visually inspected the three lowest-richness clusters in the sample. One cluster is affected by masking due to a bright star, another may be impacted by an X-ray point source, and the third is at a very low redshift (z = 0.13), where current issues with the Q1 photometric data may compromise the richness measurement.
4.2. Forecasting confirmation performance at high redshift
As the number of real ICM-selected cluster candidates is small, we must base the forecast of confirmation performance solely on the properties of the measurements along random lines of sight. As shown in Fig. 3, the richness distribution along random lines of sight is approximately redshift-independent for the Euclid-based MCMF.
From Fig. 4 as well as from direct comparison of richnesses from Euclid-MCMF with those of ACT-DR5 MCMF (see Fig. A.2), we found no evidence that the richness is biased or degraded with respect to the original richness estimates from ACT-DR5 MCMF. This allows us to directly compare the richness distributions along random lines of sight from the original ACT-DR5 MCMF work (Klein et al. 2024b) with those derived in this study. These richness distributions are shown in the left-hand panel of Fig. 5, illustrating the fraction of randoms exceeding a certain richness threshold (λmin). Shown are the Euclid Q1 measurements at z > 1, compared to the WISE-MCMF version and those derived from DES- or LSDR10-like MCMF measurements at z < 0.6.
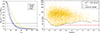 |
Fig. 5. Left: Richness distribution along random lines of sights and above z > 1 from Euclid-MCMF compared to WISE-based MCMF above z > 1 as well as DES-based MCMF at z < 0.6. The richness distributions of Euclid-MCMF follows closely that of the low-z DES measurement and significantly improves over WISE. Right: Distribution of ACT-DR5 MCMF clusters in richness versus redshift. The richness threshold (λmin) to confirm ACT-DR5 clusters based on LSDR10 and WISE data is shown as grey line. The properties of Euclid-MCMF measurements along random lines of sight suggest that future Euclid-based confirmation will allow s similar performance at z > 1 as current-day DES-based confirmation at z < 0.6, indicated by the dashed red line. |
The WISE-MCMF measurements were previously used to confirm most ACT-DR5 MCMF clusters at z > 1, where the ground-based DES/LSDR10 photometry was not sufficiently deep. Comparing WISE-MCMF with Euclid-MCMF, it is evident that the richness distribution for Euclid-MCMF declines much more steeply. This allows one to exclude 80% of chance superpositions at richness values of approximately ∼15, compared to ∼25 for WISE-MCMF. Moreover, the richness distribution is in close agreement with that of ground-based data at z < 0.6, where the imaging depth of those surveys is sufficient for cluster confirmation.
The right-hand panel of Fig. 5 shows the redshift and richness distribution of the ACT-DR5 MCMF catalogue, including the redshift-dependent richness cut used to construct the sample and ensure a constant level of purity as a function of redshift. This selection exhibits several features related to the limitations of the different surveys used to construct the sample. The upturn in λmin at low redshift is due to the SZE selection function and the reduced ability to detect very extended clusters at low z. The minimum of λmin occurs around z ≈ 0.5, where the bulk of the real ACT-DR5 clusters are located, followed by an increase towards z ≈ 1.2 due to limitations of the optical survey. At higher redshifts (z ≥ 1.1), WISE-based confirmation becomes more effective than ground-based data, causing the richness threshold to remain approximately constant.
The richness distribution along random lines of sight for Euclid-MCMF being approximately similar to that of lower-redshift optical surveys suggests that, for ACT-DR5-like surveys, the redshift-dependent richness cut could remain at the level currently only achieved at redshifts of z ≈ 0.6. While current SZE surveys such as ACT-DR5 MCMF are not strongly impacted by incompleteness due to their relatively high mass thresholds and the small fraction of high-redshift clusters, future samples from surveys such as SPT-3G (Benson et al. 2014), SO (Ade et al. 2019), and CMB-S4 (Abazajian et al. 2022) will benefit significantly from the enhanced high-redshift cluster confirmation capabilities offered by Euclid data.
4.3. Discussion of individual high-z clusters
Compared to ground-based data, Euclid offers uniquely high imaging resolution along with simultaneously deep YE, JE, and HE imaging. These capabilities become especially important for distant clusters, where the rest-frame optical bands are redshifted into the infrared regime, and where imaging resolution becomes crucial for resolving individual cluster member galaxies. In the following subsection, we therefore discuss all high-redshift (z > 1) clusters in our sample of ICM-selected clusters.
4.3.1. 1eRASS J040527.1−490347
The Euclid-MCMF measurement of 1eRASS J040527.1−490347 reveals a rich cluster (λ = 76) at z = 1.1. In Fig. 6, we show the IE, YE, HE-band colour composite of the central region around the cluster. According to the redshifts given in the eRASS1 cluster catalogue (Bulbul et al. 2024), no eRASS1 cluster in the Q1 field is expected to exceed z = 1. The redshift of z = 0.254 ± 0.015 listed for 1eRASS J040527.1−490347 in Bulbul et al. (2024) is inconsistent with the redshift derived using Euclid photometry.
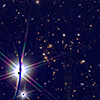 |
Fig. 6. Euclid IE, YE, and HE band colour composite image of the central 2′×2′ region of 1eRASS J040527.1−490347 (z = 1.1). While the bright stars in the south-east corner may have impacted previous confirmation and may act as additional X-ray emitters, a massive cluster is clearly visible in the Euclid imaging data. |
The most likely reason for this mismatch is the presence of bright point sources in the vicinity of the cluster, combined with the high redshift of the system. These factors likely caused the cluster galaxies to be either masked out or too faint to be detected in the ground-based imaging data alone.
4.3.2. SPT-CL J0354−4815
SPT-CL J0354−4815 is the cluster with the lowest SZE significance among all z > 1 clusters in Q1. With a cluster richness of λ ≈ 75, it is well detected in the Euclid data. The redshift of z = 1.13 is in good agreement with the value listed in the SPT-SZ MCMF catalogue (1.14 ± 0.06). This redshift is independently confirmed through a nearby cross-match with the optical cluster catalogue by Wen & Han (2024), who report z = 1.16.
4.3.3. ACT-CL J0353.0−4818, SPT-CL J0353−4818
The cluster ACT-CL J0353.0−4818, also known as SPT-CL J0353−4818, is robustly detected in both SZE surveys. The Euclid-based MCMF analysis yields a redshift of z = 1.13 when using SPT priors, and a highly consistent value of z = 1.14 when using ACT-DR5 priors. These estimates align well with those from ACT-DR5 MCMF (z = 1.21 ± 0.08), SPT-SZ MCMF (z = 1.22 ± 0.06), and the value reported by Wen & Han (2024) (z = 1.165) using independent optical cluster finding. Earlier versions of the ACT-DR5 and SPT-SZ catalogues (Hilton et al. 2021; Bleem et al. 2015) reported lower redshifts for this system: z = 0.93 ± 0.03 and z = 0.96, respectively. Despite being a well-detected SZE cluster, the appearance of this system in Euclid imaging is less prominent. As shown in Fig. 7, red galaxies are sparsely distributed over an extended region elongated along the north-east to south-west axis. The brightest cluster galaxy (BCG) lies approximately 17″ from the ACT-DR5 position and around 36″ from the SPT position. This optical morphology suggests that the cluster is not a relaxed system.
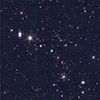 |
Fig. 7. Euclid IE, YE, and HE band colour composite image of a 3′×3′ region around ACT-CL J0353.0−4818 (SPT-CL J0353−4818). The ACT-DR5 position is marked by a white square, the SPT-SZ position is marked by a white circle. The offset between both SZE-based positions is typical for offsets found between SPT-SZ and ACT-DR5 clusters. |
4.3.4. SPT-CL J0353−5043
SPT-CL J0353−5043 is a well-detected SPT cluster with an SPT signal-to-noise ratio of ξ = 5.35 and a redshift of z = 1.315 ± 0.067 according to SPT-SZ MCMF. The Euclid MCMF estimate yields z = 1.32, fully consistent with the published value. The SZE position lies 11″ from a large passive galaxy, which likely corresponds to the BCG of the system.
The left panel of Fig. 8 shows a colour composite image of the central region of SPT-CL J0353−5043 using the Euclid VIS IE and NIR YE and HE bands. The BCG is visible in the northern half of the image, while the field also includes a second bright galaxy in the southern region. The field of view corresponds to approximately 350 kpc. The right panel of Fig. 8 shows the IE band alone in greyscale, marking three interesting galaxies. Galaxies labelled 2 and 3 are likely arcs from strongly lensed background galaxies. Additional tentative lensing features are visible near the BCG and the southern elliptical galaxy. A comparison of the colour and IE-band images reveals that cluster members, particularly the BCG, appear faint in the IE band relative to the NISP bands. This behaviour results from the IE band probing the rest-frame UV regime (240–390 nm) at the cluster redshift, which is sensitive to recent star formation. The faintness of the BCG in this band suggests a lack of significant ongoing star formation and supports the picture that the BCG in massive clusters at redshifts z ∼ 1.3 are predominantly passive galaxies. For cluster lenses at these redshifts this yields a significantly increased contrast in IE between lensed star-forming galaxies and their lenses dominated by passive galaxies. We refer the interested reader to Euclid Collaboration: Bergamini et al. (2026) for a dedicated search for strong-lensing galaxy clusters in Q1.
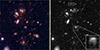 |
Fig. 8. Left: Euclid IE, YE, and HE band colour composite image of the central 40″ × 40″ region of SPT-CL J0353−5043. Right: Greyscale image of the same region in Euclid IE. Boxes mark the highest redshift jellyfish candidate to date (1) and two strongly lensed galaxies (2, 3). |
In contrast, a jellyfish-shaped blue galaxy (EUCL J035330.86−504347.6) is visible near the centre of the image. This galaxy, marked with number 1 in the right-hand panel of Fig. 8, has a photometric redshift of z = 1.34 ± 0.03 from the Euclid photo-z pipeline, which is highly consistent with the cluster redshift. Jellyfish galaxies are formed through interactions between the intracluster medium and the interstellar medium of infalling galaxies, which experience strong ram-pressure stripping (Gunn & Gott 1972; Boselli & Gavazzi 2006). Due to the high infall velocity, the galaxy’s gas is stripped and trails behind, forming a tail in the direction opposite to its motion. Under favourable conditions, star formation can happen within this stripped tail, making such galaxies bright in optical and UV bands, with the star-forming disc and the tail giving a jellyfish appearance (Owen et al. 2006; Cortese et al. 2007; Owers et al. 2012; Ebeling et al. 2014; Poggianti et al. 2016; George et al. 2018). This scenario is consistent with the morphology observed in Fig. 8, where the galaxy appears to be moving towards the BCG and cluster centre, with the stripped gas, hosting ongoing star formation, trailing in the opposite direction. Its shape, colour, photometric redshift, and the direction of the stripped component, strongly suggest that EUCL J035330.86−504347.6 is indeed a jellyfish galaxy at z ≈ 1.32. Spectroscopic redshift and kinematic information of the disc and tails are required to confirm the ram-pressure stripping nature of the galaxy. If validated, this galaxy could represent one of the highest-redshift jellyfish galaxies found in an ICM-selected cluster to date.
4.3.5. SPT-CL J0421−4845
SPT-CL J0421−4845 belongs to a subset of five z > 1.4 clusters that were studied in greater detail by Strazzullo et al. (2019) using Hubble imaging data. The original photometric redshift of z = 1.42 ± 0.09 from the SPT-SZ cluster catalogue (Bleem et al. 2015) was refined to z = 1.38 ± 0.02 by Strazzullo et al. (2019), placing the cluster slightly below the original redshift selection threshold of z = 1.4 for their sample. Using our MCMF adaptation to Euclid data, we find z = 1.41, in good agreement with previous estimates. In contrast, the redshift reported in the SPT-SZ MCMF catalogue, z = 1.58 ± 0.08, based on Legacy Survey DR10 and WISE data, is ∼2σ higher than the values found by other studies. A likely explanation is a bright AGN located approximately 5″ south of the BCG, which severely affects the WISE photometry in the cluster core. The red appearance of this source in WISE bands likely biases the redshift estimate towards higher values.
The central region of SPT-CL J0421−4845, shown in Fig. 9, reveals several galaxies that appear to be strongly lensed by the cluster potential. In addition to the Euclid IE, YE, HE colour composite (left panel) and the IE image (central panel), we include an HST F140W image with a total exposure time of 2400 s. Four galaxies, marked with white rectangles, exhibit tangential alignment relative to the cluster centre and have colours consistent with background galaxies, making them strong lensing candidates. Despite the availability of HST imaging, no dedicated strong or weak lensing analysis has yet been conducted for this cluster. The combination of existing HST and new Euclid imaging makes SPT-CL J0421−4845 a compelling target for cross-instrumental lensing studies.
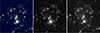 |
Fig. 9. Central 30″ × 30″ region of SPT-CL J0421−4845. Left: Euclid IE, YE, and HE colour composite image. Middle: Greyscale image using Euclid IE. Right: Greyscale image using HST F140W. Marked are four candidates of strongly lensed galaxies. |
4.3.6. ACT-CL J0350.0−4819
ACT-CL J0350.0−4819, shown in Fig. 1, is the highest-redshift cluster identified by our MCMF analysis of Euclid data, with a photometric redshift of z = 1.46, consistent with the ACT-DR5 MCMF value of z = 1.38 within the expected uncertainties. Given this high redshift, ground-based data are nearing their limit in redshift determination. In the case of the WISE-based redshift estimate, two blue galaxies near the cluster core are blended with the core of the cluster, complicating accurate photometric measurements for this cluster. This highlights the advantage of the high-resolution infrared imaging capabilities of Euclid compared to current large-scale surveys.
In Fig. 10, we take advantage of Euclid’s excellent image resolution and present a 30″ × 30″ image of the cluster core. Near the central passive galaxy, we mark two blue galaxies. Visual inspection reveals similar colours for both galaxies, but photometric redshifts from Euclid differ significantly. The northern blue galaxy (NBG; EUCL J035000.73−481943.8) has a photometric redshift of z = 1.55, while the southern blue galaxy (SBG; EUCL J035000.64−481945.4) has z = 0.05. This difference in redshifts might be explained by degeneracies in colour space between low- and high-redshift galaxies visbile as redshift outliers at low photometric redshifts (Euclid Collaboration: Tucci et al. 2026). Their irregular morphologies and the small angular separation between both galaxies in fact suggests that both galaxies are likely interacting with each other. The small separation to the cluster BCG together with redshift consistency of the NBG with the cluster redshift further supports a scenario where both star-forming galaxies are associated with ACT-CL J0350.0−4819. Additional data, such as spectroscopic redshifts, are needed to confirm the nature of this system and its relation to the cluster.
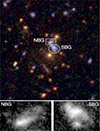 |
Fig. 10. Top: Euclid IE, YE, and HE colour composite of a |

5. Conclusions and outlook
In this work, we investigated the capabilities of Euclid in the follow-up and confirmation of ICM-selected galaxy clusters using data from the Euclid Q1. We measured Euclid-based redshifts and richnesses for clusters drawn from four of the largest ICM-selected samples to date: RASS-MCMF, SPT-SZ MCMF, ACT-DR5 MCMF, and eROSITA eRASS1.
Our adaptation of the MCMF algorithm to Euclid Q1 data demonstrates reasonable performance in both redshift and richness estimation and is expected to perform even better with the upcoming DR1 dataset. While redshift measurements perform well across the full range, we encountered challenges in richness estimation for low-z clusters. These are partially mitigated by excluding the g- and r-band from the richness calculation.
The redshift estimates, particularly at high redshift (z > 1), where ground-based optical surveys typically lose sensitivity, show excellent agreement with previously published values. While this confirms the general quality of the samples used in this work, we also identify one case where the superior imaging quality of Euclid revises a published MCMF-based redshift. In the case of SPT-CL J0421−4845, our Euclid-based MCMF analysis confirms the redshift of z ∼ 1.4 reported by Bleem et al. (2015) and Strazzullo et al. (2019) based on HST and Spitzer, while revealing that the WISE-based MCMF redshift in the SPT-SZ catalogue (Klein et al. 2024a) is biased high by ∼2σ, due to AGN contamination near the cluster core.
Richness estimates derived from the Euclid-based MCMF show generally high correlation with ICM-based mass estimates. However, the performance remains suboptimal due to challenges in Q1 photometry and the current inability to self-calibrate red sequence models within the small Q1 dataset. These issues are expected to be resolved in future releases. Nonetheless, even with the current Q1 dataset, Euclid’s high-redshift performance, particularly in the NISP bands, is already outstanding.
By applying MCMF to random lines of sight, we show that the noise properties of Euclid-based richnesses at z > 1 are comparable to those achieved by modern ground-based surveys at z < 0.6. This marks a significant improvement over WISE-based cluster confirmation currently driving high-z cluster confirmation and demonstrates Euclid’s potential to identify the majority of high-redshift ICM-selected clusters from future surveys. We find threshold of λ ≈ 15 in Euclid-based MCMF would be sufficient to produce a clean cluster catalogue for an ACT-DR5-like cluster candidate list.
We further leveraged Euclid’s deep, high-resolution imaging data to study the z > 1 cluster subsample in more detail. Notably, we revise the redshift of one eRASS1 cluster 1eRASS J040527.1−490347 from z = 0.254 ± 0.015 to z = 1.1, with the discrepancy likely due to masking by bright stars in the vicinity of the cluster. All five SZE-selected clusters at z > 1 are reconfirmed to be at high redshift. In SPT-CL J0353−5043 and SPT-CL J0421−4845, we find evidence for strong lensing features, and in ACT-CL J0350.0−4819, we identify two massive, star-forming galaxies near the BCG. Spectroscopic follow-up is needed to confirm their cluster membership and investigate their possible interaction or merger with the BCG.
Finally, we report the discovery of the highest-redshift jellyfish galaxy in an ICM-selected cluster known to date. The galaxy EUCL J035330.86−504347.6, located less than 20″ from the BCG of SPT-CL J0353−5043 at z = 1.32, has a photometric redshift consistent with the cluster. The Euclid IE-band imaging, probing the rest-frame UV (240–390 nm), shows clear evidence of ram-pressure stripping. The extended stellar emission points away from the cluster centre, consistent with jellyfish morphology. If confirmed with spectroscopic redshift and kinematic information of the disc and tail, this would push the redshift frontier for jellyfish galaxies from z = 0.8 (Durret et al. 2021) to z = 1.32, thereby setting constraints on the role of environment-driven star formation quenching in high-redshift galaxies. The combination of broad VIS-band coverage and high imaging quality in Euclid is likely well suited for identifying jellyfish galaxies in high-redshift clusters, making this discovery potentially the first of many in the upcoming wide survey.
The increased area covered by the Euclid Wide Survey, together with recent and upcoming deep SZE surveys such as those based on SPT-3G (Archipley et al. 2026; Benson et al. 2014), will result in a significant increase in the number of ICM-selected galaxy clusters at high redshifts. Besides being valuable probes for cosmological and astrophysical studies, the overlap with Euclid-selected galaxy clusters will allow further investigation into systematics related with either surveys. The availability of the SZE-based mass proxy out to high redshift can further be used to test and improve optical mass proxies such as the cluster richness estimated by MCMF or by the RICH-CL function (Castignani & Benoist 2016) within Euclid galaxy cluster workflow (Euclid Collaboration: Bhargava et al. 2026).
Acknowledgments
This work has made use of the Euclid Q1 data from the Euclid mission of the European Space Agency (ESA), 2025, [https://doi.org/10.57780/esa-2853f3b|https://doi.org/10.57780/esa-2853f3b]. a number of agencies and institutes that have supported the development of Euclid, in particular the Agenzia Spaziale Italiana, the Austrian Forschungsförderungsgesellschaft funded through BMIMI, the Belgian Science Policy, the Canadian Euclid Consortium, the Deutsches Zentrum für Luft- und Raumfahrt, the DTU Space and the Niels Bohr Institute in Denmark, the French Centre National d’Etudes Spatiales, the Fundação para a Ciência e a Tecnologia, the Hungarian Academy of Sciences, the Ministerio de Ciencia, Innovación y Universidades, the National Aeronautics and Space Administration, the National Astronomical Observatory of Japan, the Netherlandse Onderzoekschool Voor Astronomie, the Norwegian Space Agency, the Research Council of Finland, the Romanian Space Agency, the Swiss Space Office (SSO) at the State Secretariat for Education, Research, and Innovation (SERI), and the United Kingdom Space Agency. A complete and detailed list is available on the Euclid web site (www.euclid-ec.org/consortium/community/).
References
- Abazajian, K., Abdulghafour, A., Addison, G. E., et al. 2022, arXiv e-prints [arXiv:2203.08024] [Google Scholar]
- Abbott, T., Abdalla, F. B., Aleksić, J., et al. 2016, MNRAS, 460, 1270 [Google Scholar]
- Ade, P., Aguirre, J., Ahmed, Z., et al. 2019, JCAP, 02, 056 [CrossRef] [Google Scholar]
- Aguena, M., Aiola, S., Allam, S., et al. 2026, Open J. Astrophys., 9, 55863 [Google Scholar]
- Archipley, M., Hryciuk, A., Bleem, L. E., et al. 2026, A&A, 706, A17 [NASA ADS] [CrossRef] [EDP Sciences] [Google Scholar]
- Artis, E., Ghirardini, V., Bulbul, E., et al. 2024, A&A, 691, A301 [NASA ADS] [CrossRef] [EDP Sciences] [Google Scholar]
- Benson, B. A., Ade, P. A. R., Ahmed, Z., et al. 2014, SPIE Conf. Ser., 9153, 91531P [NASA ADS] [Google Scholar]
- Bleem, L. E., Stalder, B., de Haan, T., et al. 2015, ApJS, 216, 27 [Google Scholar]
- Bleem, L. E., Bocquet, S., Stalder, B., et al. 2020, ApJS, 247, 25 [Google Scholar]
- Bleem, L. E., Klein, M., Abbot, T. M. C., et al. 2024, Open J. Astrophys., 7, 13 [CrossRef] [Google Scholar]
- Bocquet, S., Grandis, S., Bleem, L. E., et al. 2024, Phys. Rev. D, 110, 083510 [NASA ADS] [CrossRef] [Google Scholar]
- Böhringer, H., Chon, G., Collins, C. A., et al. 2013, A&A, 555, A30 [Google Scholar]
- Boller, T., Freyberg, M. J., Trümper, J., et al. 2016, A&A, 588, A103 [NASA ADS] [CrossRef] [EDP Sciences] [Google Scholar]
- Boselli, A., & Gavazzi, G. 2006, PASP, 118, 517 [Google Scholar]
- Bulbul, E., Liu, A., Kluge, M., et al. 2024, A&A, 685, A106 [NASA ADS] [CrossRef] [EDP Sciences] [Google Scholar]
- Carlstrom, J. E., Ade, P. A. R., Aird, K. A., et al. 2011, PASP, 123, 568 [CrossRef] [Google Scholar]
- Castignani, G., & Benoist, C. 2016, A&A, 595, A111 [NASA ADS] [CrossRef] [EDP Sciences] [Google Scholar]
- Chiu, I., Klein, M., Mohr, J., & Bocquet, S. 2023, MNRAS, 522, 1601 [NASA ADS] [CrossRef] [Google Scholar]
- Cortese, L., Marcillac, D., Richard, J., et al. 2007, MNRAS, 376, 157 [Google Scholar]
- Coutinho, D., Ramos-Ceja, M. E., Dennerl, K., et al. 2022, SPIE Conf. Ser., 12181, 121811A [NASA ADS] [Google Scholar]
- Dey, A., Schlegel, D. J., Lang, D., et al. 2019, AJ, 157, 168 [Google Scholar]
- Durret, F., Chiche, S., Lobo, C., & Jauzac, M. 2021, A&A, 648, A63 [NASA ADS] [CrossRef] [EDP Sciences] [Google Scholar]
- Ebeling, H., Stephenson, L. N., & Edge, A. C. 2014, ApJ, 781, L40 [Google Scholar]
- Euclid Collaboration (Adam, R., et al.) 2019, A&A, 627, A23 [NASA ADS] [CrossRef] [EDP Sciences] [Google Scholar]
- Euclid Collaboration (Aussel, H., et al.) 2026, A&A, 711, A1 (Euclid Q1 SI) [Google Scholar]
- Euclid Collaboration (Bergamini, P., et al.) 2026, A&A, 711, A33 (Euclid Q1 SI) [Google Scholar]
- Euclid Collaboration (Bhargava, S., et al.) 2026, A&A, 711, A34 (Euclid Q1 SI) [Google Scholar]
- Euclid Collaboration (Cropper, M. S., et al.) 2025, A&A, 697, A2 [Google Scholar]
- Euclid Collaboration (Jahnke, K., et al.) 2025, A&A, 697, A3 [Google Scholar]
- Euclid Collaboration (McCracken, H. J., et al.) 2026, A&A, 711, A2 (Euclid Q1 SI) [Google Scholar]
- Euclid Collaboration (Mellier, Y., et al.) 2025, A&A, 697, A1 [Google Scholar]
- Euclid Collaboration (Polenta, G., et al.) 2026, A&A, 711, A3 (Euclid Q1 SI) [Google Scholar]
- Euclid Collaboration (Romelli, E., et al.) 2026, A&A, 711, A4 (Euclid Q1 SI) [Google Scholar]
- Euclid Collaboration (Tucci, M., et al.) 2026, A&A, 711, A5 (Euclid Q1 SI) [Google Scholar]
- Euclid Quick Release Q1. 2025, https://doi.org/10.57780/esa-2853f3b [Google Scholar]
- Fazio, G. G., Hora, J. L., Allen, L. E., et al. 2004, ApJS, 154, 10 [Google Scholar]
- Finoguenov, A., Rykoff, E., Clerc, N., et al. 2020, A&A, 638, A114 [NASA ADS] [CrossRef] [EDP Sciences] [Google Scholar]
- Flaugher, B., Diehl, H. T., Honscheid, K., et al. 2015, AJ, 150, 150 [Google Scholar]
- Fowler, J. W., Niemack, M. D., Dicker, S. R., et al. 2007, Appl. Opt., 46, 3444 [Google Scholar]
- George, K., Poggianti, B. M., Gullieuszik, M., et al. 2018, MNRAS, 479, 4126 [Google Scholar]
- Ghirardini, V., Bulbul, E., Artis, E., et al. 2024, A&A, 689, A298 [NASA ADS] [CrossRef] [EDP Sciences] [Google Scholar]
- Gladders, M. D., & Yee, H. K. C. 2000, AJ, 120, 2148 [NASA ADS] [CrossRef] [Google Scholar]
- Gonzalez, J. E., Ferreira, M., Colaço, L. R., Holanda, R. F. L., & Nunes, R. C. 2024, Phys. Lett. B, 857, 138982 [Google Scholar]
- Gunn, J. E., & Gott, J. R., III 1972, ApJ, 176, 1 [Google Scholar]
- Hernández-Lang, D., Klein, M., Mohr, J. J., et al. 2023, MNRAS, 525, 24 [CrossRef] [Google Scholar]
- Hilton, M., Sifón, C., Naess, S., et al. 2021, ApJS, 253, 3 [Google Scholar]
- Ivezić, Ž., Kahn, S. M., Tyson, J. A., et al. 2019, ApJ, 873, 111 [Google Scholar]
- Klein, M., Mohr, J. J., Desai, S., et al. 2018, MNRAS, 474, 3324 [Google Scholar]
- Klein, M., Grandis, S., Mohr, J. J., et al. 2019, MNRAS, 488, 739 [Google Scholar]
- Klein, M., Oguri, M., Mohr, J. J., et al. 2022, A&A, 661, A4 [NASA ADS] [CrossRef] [EDP Sciences] [Google Scholar]
- Klein, M., Hernández-Lang, D., Mohr, J. J., Bocquet, S., & Singh, A. 2023, MNRAS, 526, 3757 [NASA ADS] [CrossRef] [Google Scholar]
- Klein, M., Mohr, J. J., Bocquet, S., et al. 2024a, MNRAS, 531, 3973 [NASA ADS] [CrossRef] [Google Scholar]
- Klein, M., Mohr, J. J., & Davies, C. T. 2024b, A&A, 690, A322 [NASA ADS] [CrossRef] [EDP Sciences] [Google Scholar]
- Kozmanyan, A., Bourdin, H., Mazzotta, P., Rasia, E., & Sereno, M. 2019, A&A, 621, A34 [NASA ADS] [CrossRef] [EDP Sciences] [Google Scholar]
- Mantz, A. B., von der Linden, A., Allen, S. W., et al. 2015, MNRAS, 446, 2205 [Google Scholar]
- Mazoun, A., Bocquet, S., Mohr, J. J., et al. 2025, Phys. Rev. D, 111, 083543 [Google Scholar]
- Merloni, A., Lamer, G., Liu, T., et al. 2024, A&A, 682, A34 [NASA ADS] [CrossRef] [EDP Sciences] [Google Scholar]
- Naess, S., Aiola, S., Austermann, J. E., et al. 2020, JCAP, 12, 046 [Google Scholar]
- Owen, F. N., Keel, W. C., Wang, Q. D., Ledlow, M. J., & Morrison, G. E. 2006, AJ, 131, 1974 [Google Scholar]
- Owers, M. S., Couch, W. J., Nulsen, P. E. J., & Randall, S. W. 2012, ApJ, 750, L23 [Google Scholar]
- Planck Collaboration I. 2011, A&A, 536, A1 [NASA ADS] [CrossRef] [EDP Sciences] [Google Scholar]
- Planck Collaboration XXXII. 2015, A&A, 581, A14 [NASA ADS] [CrossRef] [EDP Sciences] [Google Scholar]
- Planck Collaboration XXIV. 2016, A&A, 594, A24 [NASA ADS] [CrossRef] [EDP Sciences] [Google Scholar]
- Poggianti, B. M., Fasano, G., Omizzolo, A., et al. 2016, AJ, 151, 78 [Google Scholar]
- Predehl, P., Andritschke, R., Arefiev, V., et al. 2021, A&A, 647, A1 [EDP Sciences] [Google Scholar]
- Rykoff, E. S., Rozo, E., Busha, M. T., et al. 2014, ApJ, 785, 104 [Google Scholar]
- Sartoris, B., Biviano, A., Fedeli, C., et al. 2016, MNRAS, 459, 1764 [Google Scholar]
- Schlafly, E. F., Meisner, A. M., & Green, G. M. 2019, ApJS, 240, 30 [Google Scholar]
- Strazzullo, V., Pannella, M., Mohr, J. J., et al. 2019, A&A, 622, A117 [NASA ADS] [CrossRef] [EDP Sciences] [Google Scholar]
- Sunyaev, R. A., & Zeldovich, Y. B. 1972, Comm. Astrophys. Space Phys., 4, 173 [Google Scholar]
- Trümper, J. 1993, Science, 260, 1769 [Google Scholar]
- Vogt, S. M. L., Bocquet, S., Davies, C. T., et al. 2025, Phys. Rev. D, 111, 043519 [NASA ADS] [CrossRef] [Google Scholar]
- Weaver, J. R., Kauffmann, O. B., Ilbert, O., et al. 2022, ApJS, 258, 11 [NASA ADS] [CrossRef] [Google Scholar]
- Wen, Z. L., & Han, J. L. 2024, ApJS, 272, 39 [NASA ADS] [CrossRef] [Google Scholar]
- Wright, E. L., Eisenhardt, P. R. M., Mainzer, A. K., et al. 2010, AJ, 140, 1868 [Google Scholar]
- York, D. G., Adelman, J., Anderson, J. E., Jr, et al. 2000, AJ, 120, 1579 [Google Scholar]
Appendix A: Additional information on redshift and richnesses
In Fig. A.1 we compare the redshifts estimated using all available bands, with those omitting the g band and omitting g and r band fluxes. The redshifts are reasonably recovered over the full redshift range, even in cases where where the 4000Å break is in the g or r band (below z ≈ 0.4 and z ≈ 0.75 respectively) and the bands were not used for the redshift estimates. The agreement between different estimates suggests that the mean colours predicted by the red-sequence models are in line with the observations, as systematics will cause shifts in the redshifts estimated by different colours.
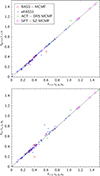 |
Fig. A.1. Redshifts obtained by MCMF using different set of bands. Top: Comparing redshift using the full colour range (g, r, i, z, YE, JE, HE) with measurements omitting the g band. Bottom: Similar but comparing the r, i, z, YE, JE, HE-based redshift with those also omitting the r band. Note, although the 4000 Å break is leaving the g band at z ≈ 0.4 and the r band at z ≈ 0.75 redshifts are reasonably recovered at lower redshift even without those bands. |
In Fig. A.2 we compare the richnesses obtained by MCMF using i, z, YE, JE, HE-bands and those published in previous MCMF catalogues using ACT-DR5 MCMF and SPT-SZ MCMF. We further limit the redshift range to z > 0.4, where the photometric problems presented in Sect. 3.1 minimal and to focus on the high-z range where Euclid-data become relevant. We find good agreement between original ACT-DR5 MCMF measurement, based on LSDR10 photometry with our measurements. This suggest that also richnesses obtained with our Euclid-based MCMF towards random lines of sight can be compared to randoms from previous MCMF runs on ACT-DR5. In case of SPT-SZ MCMF we scale the published richnesses by a factor 1.45 to account for the fact that those measurements were based on DES g, r, i, z-bands and with an older MCMF pipeline, only considering galaxies up to m* + 1.25. We find reasonable agreement with no significant bias in mean recovered richness, although with some mild indication of a steeper slope.
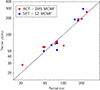 |
Fig. A.2. Comparison of richnesses obtained by MCMF on Euclid using the xyz bands with those from the published MCMF catalogues using LSDR10 photometry. We limit to z > 0.4, to avoid the issues on low-z richnesses (see Sect. 4.1). Only ACT-DR5 MCMF and SPT-SZ MCMF contribute significant number of clusters. SPT-SZ MCMF richnesses are scaled by 1.45 to bring DES-based SPT-SZ MCMF measurements to bring in line with ACT-DR5 MCMF measurements. |
All Figures
|
Fig. 1. Colour composite images of a |
| In the text | |
|
Fig. 2. The λ–z plot along the line of sight of ACT-CL J0350.0−4819, the cluster with the highest redshift measured in the sample. |
| In the text | |
|
Fig. 3. Comparison of the richness distribution along random lines of sight as a function of redshift using either WISE-based or Euclid-based MCMF measurements. No strong redshift evolution is visible for Euclid-based MCMF measurements. The lower scatter for Euclid-based MCMF suggests lower noise and hence improved separation of real clusters from contaminants. |
| In the text | |
|
Fig. 4. Left: Recovery of published redshifts with Euclid-MCMF. Redshifts of 1eRASS J040527.1−490347 (grey square) and SPT-CL J0421−4845 (yellow square) are discussed in greater detail in Sect. 4.3. Right: Euclid-MCMF richness (λ) versus ICM-based mass estimates (M500). |
| In the text | |
|
Fig. 5. Left: Richness distribution along random lines of sights and above z > 1 from Euclid-MCMF compared to WISE-based MCMF above z > 1 as well as DES-based MCMF at z < 0.6. The richness distributions of Euclid-MCMF follows closely that of the low-z DES measurement and significantly improves over WISE. Right: Distribution of ACT-DR5 MCMF clusters in richness versus redshift. The richness threshold (λmin) to confirm ACT-DR5 clusters based on LSDR10 and WISE data is shown as grey line. The properties of Euclid-MCMF measurements along random lines of sight suggest that future Euclid-based confirmation will allow s similar performance at z > 1 as current-day DES-based confirmation at z < 0.6, indicated by the dashed red line. |
| In the text | |
|
Fig. 6. Euclid IE, YE, and HE band colour composite image of the central 2′×2′ region of 1eRASS J040527.1−490347 (z = 1.1). While the bright stars in the south-east corner may have impacted previous confirmation and may act as additional X-ray emitters, a massive cluster is clearly visible in the Euclid imaging data. |
| In the text | |
|
Fig. 7. Euclid IE, YE, and HE band colour composite image of a 3′×3′ region around ACT-CL J0353.0−4818 (SPT-CL J0353−4818). The ACT-DR5 position is marked by a white square, the SPT-SZ position is marked by a white circle. The offset between both SZE-based positions is typical for offsets found between SPT-SZ and ACT-DR5 clusters. |
| In the text | |
|
Fig. 8. Left: Euclid IE, YE, and HE band colour composite image of the central 40″ × 40″ region of SPT-CL J0353−5043. Right: Greyscale image of the same region in Euclid IE. Boxes mark the highest redshift jellyfish candidate to date (1) and two strongly lensed galaxies (2, 3). |
| In the text | |
|
Fig. 9. Central 30″ × 30″ region of SPT-CL J0421−4845. Left: Euclid IE, YE, and HE colour composite image. Middle: Greyscale image using Euclid IE. Right: Greyscale image using HST F140W. Marked are four candidates of strongly lensed galaxies. |
| In the text | |
|
Fig. 10. Top: Euclid IE, YE, and HE colour composite of a |
| In the text | |
|
Fig. A.1. Redshifts obtained by MCMF using different set of bands. Top: Comparing redshift using the full colour range (g, r, i, z, YE, JE, HE) with measurements omitting the g band. Bottom: Similar but comparing the r, i, z, YE, JE, HE-based redshift with those also omitting the r band. Note, although the 4000 Å break is leaving the g band at z ≈ 0.4 and the r band at z ≈ 0.75 redshifts are reasonably recovered at lower redshift even without those bands. |
| In the text | |
|
Fig. A.2. Comparison of richnesses obtained by MCMF on Euclid using the xyz bands with those from the published MCMF catalogues using LSDR10 photometry. We limit to z > 0.4, to avoid the issues on low-z richnesses (see Sect. 4.1). Only ACT-DR5 MCMF and SPT-SZ MCMF contribute significant number of clusters. SPT-SZ MCMF richnesses are scaled by 1.45 to bring DES-based SPT-SZ MCMF measurements to bring in line with ACT-DR5 MCMF measurements. |
| In the text | |
Current usage metrics show cumulative count of Article Views (full-text article views including HTML views, PDF and ePub downloads, according to the available data) and Abstracts Views on Vision4Press platform.
Data correspond to usage on the plateform after 2015. The current usage metrics is available 48-96 hours after online publication and is updated daily on week days.
Initial download of the metrics may take a while.