Fig. E.1.
Download original image
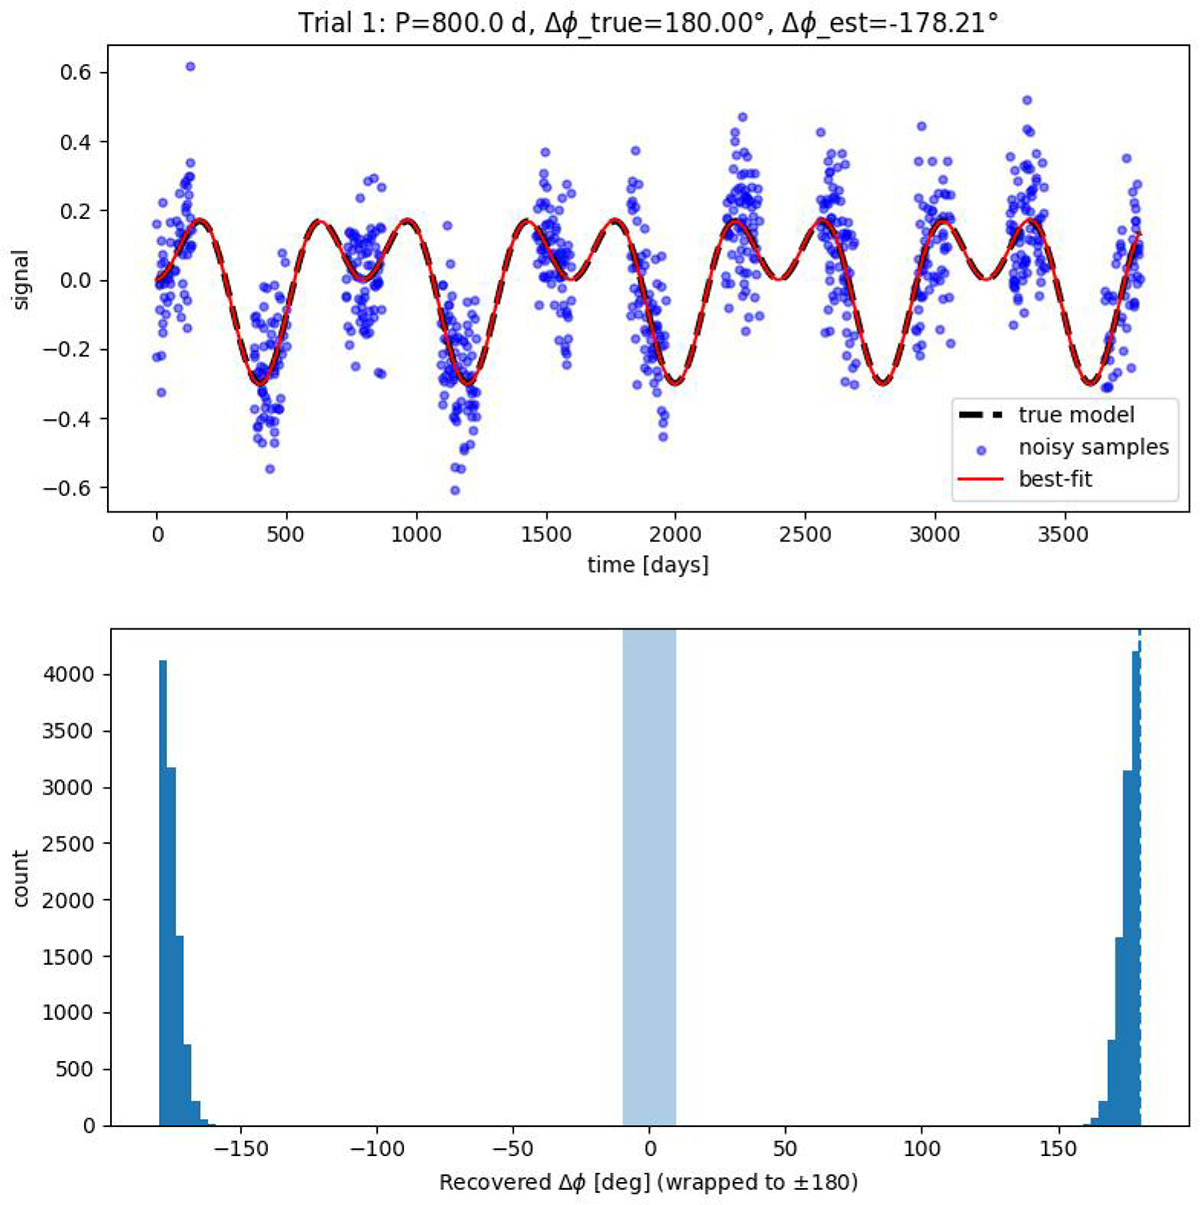
Monte Carlo test of harmonic phase recovery for a synthetic light curve with a true secondary minimum (Δϕ = 180°). Top: Example realisation showing the noiseless model (black dashed), noisy sampled data with seasonal cadence (blue points), and the best-fitting two-harmonic model recovered at the known fundamental and harmonic frequencies (red). Bottom: Distribution of recovered relative phases Δϕ = ϕ2 − 2ϕ1 over 2 × 10⁴ Monte Carlo realisations. The shaded region indicates a ±10° window around Δϕ = 0, corresponding to the secondary maxima regime. No significant population of noise-driven phase flips from Δϕ = 180° to Δϕ ≈ 0 is observed, demonstrating that such misclassification is negligible at the signal-to-noise levels considered.
Current usage metrics show cumulative count of Article Views (full-text article views including HTML views, PDF and ePub downloads, according to the available data) and Abstracts Views on Vision4Press platform.
Data correspond to usage on the plateform after 2015. The current usage metrics is available 48-96 hours after online publication and is updated daily on week days.
Initial download of the metrics may take a while.