| Issue |
A&A
Volume 669, January 2023
|
|
|---|---|---|
| Article Number | A60 | |
| Number of page(s) | 8 | |
| Section | Catalogs and data | |
| DOI | https://doi.org/10.1051/0004-6361/202141782 | |
| Published online | 09 January 2023 | |
Do Miras show long secondary periods?★
Astronomical Observatory, Jagiellonian University,
ul. Orla 171,
30-244
Kraków, Poland
e-mail: michal1.pawlak@uj.edu.pl
Received:
13
July
2021
Accepted:
12
October
2022
Aims. The long secondary period (LSP) phenomenon, which is commonly observed in pulsating red giants, has not been detected in any Mira yet. The goal of this work is to verify, if there is a physical reason for this or if it is simply an observational bias.
Methods. The OGLE-III Sample of Long Period Variables in the Large Magellanic Cloud, containing 1663 Miras, is used to perform a search for secondary periodicity in these objects and identify candidates for the long secondary period stars based on the location on the period-luminosity diagram.
Results. Out of 1663 Miras, 108 were identified as potential candidates, with variability broadly consistent with LSP. This makes 7% of the whole Mira sample in the Large Magellanic Cloud. Most, if not all, of the Mira LSP candidates are C-rich stars.
Conclusions. The results of this analysis suggest that Miras may exhibit long secondary periods. However, the long-term variability can also be related to the period and amplitude irregularities that Miras are known to exhibit. Further study will be necessary to draw a definitive conclusion.
Key words: stars: AGB and post-AGB / stars: variables: general / pulsars: general / Magellanic Clouds
Full Table 1 is also available at the CDS via anonymous ftp to cdsarc.cds.unistra.fr (130.79.128.5) or via https://cdsarc.cds.unistra.fr/viz-bin/cat/J/A+A/669/A60
© The Authors 2023
 Open Access article, published by EDP Sciences, under the terms of the Creative Commons Attribution License (https://creativecommons.org/licenses/by/4.0), which permits unrestricted use, distribution, and reproduction in any medium, provided the original work is properly cited.
This article is published in open access under the Subscribe-to-Open model. Subscribe to A&A to support open access publication.
1 Introduction
Long period variables (LPVs) are red giant branch (RGB) and asymptotic giant branch (AGB) stars that show regular or semi-regular, periodic variability of the luminosity due to radial, often multi-modal, pulsations. Apart from pulsations, a large number of LPVs show an additional type of variability known as the long secondary periods (LSPs). The term LSP was introduced by Wood et al. (1999); however, the phenomenon itself has been observed before (O’Connell 1933; Payne-Gaposchkin 1954; Houk 1963). Soszyński et al. (2007) estimated that between 25% and 50% of LPVs in the OGLE Collection of the Variable Stars (OCVS) in the Magellanic Clouds show LSPs. The LSP was also observed in 26% of the LPVs in the ASAS-SN/APOGEE catalog of variable stars (Pawlak et al. 2019).
Despite the large number of known LSP stars and the fact that the phenomenon has been known for decades, the mechanism behind it remains unclear. The two most likely hypotheses on the origin of LSPs are either nonradial pulsation modes (Wood 2000a,b; Hinkle et al. 2002; Wood et al. 2004; Saio et al. 2015) or binarity with a low-mass, substellar companion –either a brown dwarf or a large exoplanet (Wood et al. 1999; Soszyński 2007; Soszyński & Udalski 2014; Soszyński et al. 2021).
The OCVS distinguishes three classes of LPVs: OSARGs, SRVs, and Miras. The vast majority of the known LSP stars belong to the first class, while some of the SRVs are also known to show LSP. However, none of the known Mira variables have been confirmed to have LSPs.
The lack of LSP Miras may be due to a physical reason. Miras are very specific objects in terms of their evolutionary status and variability pattern; therefore, some of their characteristics may impede the onset of LSP variability. This possibility is even harder to exclude due to the fact that the mechanism behind LSPs is still not fully explained. For instance, if the LSP is tied specifically to the first-overtone pulsation (Trabucchi et al. 2017; McDonald & Trabucchi 2019) or a transition between different pulsation modes (Pawlak et al. 2019), it will naturally not appear in Miras, which are fundamental-mode pulsators. However, it is also possible that the lack of LSP detection in Miras is simply an observational bias. As Miras typically have very high amplitudes of the fundamental mode pulsations, it is likely that any other type of variability present in them would be obscured by the principal source of variability.
It should also be noted that while no clear Mira LSP has been identified yet, the existence of long-timescale variability in Miras is well known. The irregularities of periods in Miras were already studied by Eddington & Plakidis (1929). Significant changes in periods of individual Miras were detected by Plakidis (1932) and Sterne & Campbell (1937). More recent studies show that Miras can undergo changes in period, mean magnitude, and amplitude (Percy & Au 1999; Percy & Colivas 1999).
The goal of this paper is to investigate whether the lack of LSPs in Miras is caused by a physical element or an observational bias. The structure of the paper is as follows. In Sect. 2, I describe the data set that I used and the analysis I performed. I discuss the results in Sect. 3 and summarize them in Sect. 4.
2 Analysis
For the purpose of this study, I used the OGLE-III catalog of LPVs in the Large Magellanic Cloud (Soszyński et al. 2007). The technical details of the OGLE-III survey can be found in Udalski (2003). The analyzed sample contains 1663 Miras, none of them marked as an LSP star. At the same time, there are 6586 and 365 stars flagged as LSPs among the 78 919 OSARGs and 11123 SRVs, respectively. The selection of Miras in the OGLE catalog was based on the method described in Soszyński et al. (2005). The criterion that was used was the location of the star on the near-infrared period-luminosity (PL) diagram and the amplitude higher than 2.5 mag or 0.9 mag in V and I-band, respectively. The final classification was verified by visual inspection of the light curves.
The fact that an LSP is very often detected in low-amplitude OSARGs, but only in a small number of higher amplitude SRVs suggests that a selection bias might be present. Pulsational variability in SRVs has amplitudes that are often comparable to or higher than the typical amplitudes of the LSP. Therefore, an LSP is likely to remain undetected in many cases, as it is obscured by the pulsational variability. This bias can potentially be even stronger in Miras, where the fundamental-mode pulsations typically have amplitudes of a few magnitudes. These would always be significantly higher than the amplitude of putative LSP variability, which rarely exceeds 1 mag.
For each of the Miras, I subtracted the main variability from the I-band light curve using the killharm routine included in the VARTOOLS data analysis package (Hartman & Bakos 2016). For this, I used the strongest period given by OGLE and subtracted a four-harmonic model. Miras variability is not as strictly periodic as, for example, classical Cepheids; therefore, this procedure does not remove the original periodicity completely. However, it does remove the dominant peak corresponding to it from the Fourier frequency spectrum. This allowed for automatic detection of the secondary peak if present. The procedure also displaced the original variability to the level that allowed for visual inspection of secondary periodicity, which would otherwise have been obscured by the primary, high-amplitude pulsation.
I ran a new period search on each of the period-subtracted light curves with the generalized Lomb–Scargle periodogram method (Zechmeister & Kürster 2009) using the LS routine from VARTOOLS package. First, I attempted to search for long periods using only the OGLE-III photometry. However, the time span of OGLE-III turned out to be insufficient to reliably detect periods longer than 1600 days.
In order to obtain a longer time base, I extracted the OGLE-IV photometric data (Udalski et al. 2015; Iwanek et al. 2021a) and combined it with the OGLE-III photometry. Then, I reran the pulsation period subtraction and period search with the same procedure, but in the period ranging from 40 to 2500 days. The lower limit was deliberately set to a value significantly lower than the typical LSP value in order to detect any additional pulsational variability that could have appeared as an alias in the long period range. I set the signal-to-noise ratio required for a Mira to be selected as a candidate to S/N > 20.
Figure 1 presents the PL diagram for all the OGLE-III LPVs, divided into three classes: OSARGs, SRVs, and Miras plotted with their most prominent period reported in the catalog (Soszyński et al. 2007). WJK is an infrared Wesenheit index designed as
 (1)
(1)
which should be reddening independent. The J and Ks magnitudes come from the 2MASS survey (Skrutskie et al. 2006).
I placed the 208 selected candidates on the PL diagram (Fig. 1) using the new, long periods obtained for the combined light curves. It can be seen that these stars separate into two groups. One is lying on sequence C, where the pulsational periods of Miras are located. In this case, the residuals of the original pulsational period are still the strongest source of periodicity detected, meaning it is unlikely to be any LSP present; therefore, I removed them from the list. The second group lies in the prolongation of sequence D, which is where the putative LSP Miras would be expected to appear. Additionally, I removed 11 objects from the sample, because the long periods identified for them turned out to be a multiplication of the pulsational period.
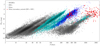 |
Fig. 1 Period-luminosity relations (PLRs) in the reddening-free WJK index, formed by the three types of LPVs: OSARGs, SRVs, and Miras as classified by Soszyński et al. (2007). Miras, for which a period with a significantly high S/N in the pre-whitened light curve was detected, are marked in red, with the strongest period detected after pre-whitening. |
3 Catalog
The selection procedure described above resulted in a list of 108 candidates for LSP Miras. Table 1 presents a shortened version of the list with the first ten records. The full list is available in an electronic and machine-readable format at the CDS. For each of the stars, the OGLE id, coordinates, and periods of both fundamental mode pulsation and putative LSP are given.
Figure 2 presents some example light curves of the C-rich Mira LSP candidates. The O-rich candidates are presented in Fig. 3. The original light curves, both unfolded and phase folded with the fundamental mode derived by Soszyński et al. (2007) are presented, as well as the light curve after fundamental period subtraction, folded with the putative LSP.
The light curves of LSP candidates show a large variety of shapes. Some of them are clearly periodic (e.g. OGLE-LMCLPV-33290 and 12633). In others, the long periodicity is visible but much less prominent (e.g. OGLE-LMC-LPV-00098, 04314, and 19756). Finally, there are light curves where the putative LSP signal is hardly visible (e.g. OGLE-LMCLPV-47038, 52708, 87402). Most of the period-subtracted light curves still show residuals of the original pulsational period. Some are also affected by long-term changes of magnitude (e.g. OGLE-LMC-LPV-04314) or pulsational period and amplitude (e.g. OGLE-LMC-LPV-47038).
These factors make visual verification of the sample challenging and prone to subjective selection bias. Therefore, I decided not to include the visual inspection in the candidate selection process and not to remove any objects, even if their period-subtracted light curves do not resemble the typical LSP light curves.
List of the Mira LSP candidates in the LMC.
4 Discussion
Out of the 1658 Miras in the LMC reported by Soszyński et al. (2007), 108 appear to show additional periodic, long-term variability. This variability seems to be broadly consistent with the LSP that is observed for other types of LPVs (OSARGs and SRVs). This makes up 7% of the whole LMC Miras sample, which is far less than the 25% given as a lower estimate of the LSP fraction for the whole population of LPVs by Soszyński et al. (2007), but still a significant fraction. It should also be noted that this number can be underestimated since some of the LSP Miras might not have passed the S/N criteria.
Since no other sample of know LSP Miras is available for comparison, I used the sample of OGLE LSP SRVs in the LMC as the closest analog. Figure 4 presents the PL relation formed by both LSP SRVs and Mira candidates in the P–WJK plane. The relations derived by Soszyński (2007) for the sequence D are marked with solid and dashed lines for C- and O-rich stars, respectively. The LSP Mira candidates appear to lie on the prolongation of the PL relation formed by LSP SRVs. However, the scatter in the magnitude is too large to derive a meaningful slope of a PL relation.
A recent study by Iwanek et al. (2021b) showed that PL relations for Miras can be derived very accurately in the WISE (Wright et al. 2010) infrared filters, especially in the WISE [3.6] band. Therefore, I decided to check if this approach would also work for the putative LSP PL relation. Figure 5 presents the LSP Mira candidates in the PL plane using WISE [3.6] magnitude. Miras seem to form an extension of the SRVs relation, but the issue of a relatively large scatter remains.
I also compare the LSP amplitudes distribution of the SRVs and Miras. The amplitude vs. period distribution is presented in Fig. 6. The amplitudes of the LSP in Miras were measured after pre-whitening the main pulsational variability. The Mira LSP amplitudes fall into the same range that had been found for SRVs.
Next, I investigate how the potential Mira LSP candidates differ from the rest of the Mira population in terms of their basic properties. For that purpose, I compare the distribution of the pulsational periods and amplitudes. The cumulative distribution in the period is shown in Fig. 7 and in amplitude in Fig. 8. The pulsational periods of the LSP candidates are statistically longer than those of other Miras. It seems that the putative LSP is not present in the short-period Miras at all. This is similar to the situation observed in OSARGs and SRVs. At the same time, the comparison of amplitude distribution does not reveal any particular trend. I checked both distributions with the Kolmogorov–Smirnov test; the difference in the distribution in periods is statistically significant, while the one in amplitudes is not.
Another interesting aspect of the Mira LSP candidates is their C/O status. As noted in Pawlak et al. (2019), the emergence of LSP in LPVs can be related to the transition from O-rich to C-rich, which happens over the course of the evolution on the AGB. As Miras are typically evolved AGB stars, the fraction of C-rich stars among them is generally higher than for other LPVs. As reported in Soszyński et al. (2007), in the entire population of OGLE LMC Miras, 1194 out of 1664 (72%) are C-rich stars. Interestingly, this fraction is even higher for the 108 Mira LSP candidates, among which 100 (92%) are C-rich.
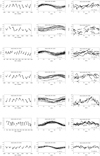 |
Fig. 2 Example light curves of the LSP Mira candidates identified in this work. For each star, the original unfolded OGLE light curve is shown in the left panel, the light curve folded with the fundamental mode pulsational period in the middle panel, and the light curve, with the fundamental mode prewhitened, folded with the putative LSP in the right panel. |
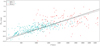 |
Fig. 4 PLR in WJK index formed by Mira LSP candidates. C-rich Miras are known LSP SRVs. PLRs derived for LSPs by Soszyński et al. (2007) are marked with solid lines (C-rich - solid line, O-rich =− dashed line). |
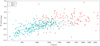 |
Fig. 5 PLR in the Wise [3.6] band. |
5 Summary and conclusions
In the OGLE catalog of the LPVs in the LMC, containing 1658 Miras, I identify 108 potential candidates for LSP Miras (7% of the whole sample). The selection is based on the secondary period search, performed after pre-whitening the primary period and related to the fundamental mode pulsation. The list of the LSP Miras candidates is available at the CDS. The results of this work suggest that Miras may show LSPs in a similar way as SRVs and OSARGs, and that the previous lack of known LSP Miras might be an observational bias.
The putative LSP variability of the selected Miras is broadly consistent with the LSP phenomenon observed in other types of LPVs in terms of their location in the PL diagram, the amplitude of the variability, as well as the light curve shape. However, this interpretation carries a certain level of uncertainty, due to the number of factors. First, pre-whitening of the fundamental mode does not remove the original pulsational variability completely, making it harder to visually verify the putative LSP. The fact that Miras are high-amplitude pulsators also contributes significantly to the uncertainty of the 2MASS and Wise infrared magnitudes, which are either single-epoch or derived from a relatively small number of measurements. Finally, the putatively long periods of Miras typically exceed 1000 days, which often means that only two or three full cycles can be observed in the currently available data set. For that reason, I chose to report the objects identified in this work as LSP candidates rather than LSP Miras.
I also note that Miras are known to show variations in period and amplitude. Therefore, an alternative explanation, attributing the long-term variability to these irregularities is possible. Further study, using data covering a longer timescale, will be necessary to differentiate between these scenarios. Verifying if the long periods are stable over a larger number of cycles will be essential in this case.
It should also be noted that the list of potential candidates might be incomplete, due to the fact that the lower amplitude LSP candidates might not have passed the S/N criterion. The sample of the Mira LSP candidates is dominated by C-rich stars to an even higher degree than the population of Miras themselves. The fact that the few O-rich stars present seem to be mostly outliers suggests that the putative Mira LSP population may be exclusively C-rich. The LSP candidates have statistically longer periods of the fundamental pulsation mode than the rest of the Mira sample. A similar feature is observed for OSARG and SRV LSPs, which may suggest that the mechanism behind these two phenomena is similar.
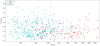 |
Fig. 6 Amplitude comparison for LSP SRVs and candidates for LSP Miras. |
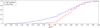 |
Fig. 7 Cumulative distribution in pulsational periods for the LSP candidates and other Miras. |
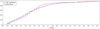 |
Fig. 8 Cumulative distribution in amplitudes of the pulsational variability for the LSP candidates and other Miras. |
Acknowledgements
I thank the Referee for their insightful comments. I also thank Igor Soszyński and Patryk Iwanek for the discussion of the results. This study has been supported by the SONATINA grant 2020/36/C/ST9/00103 from the Polish National Science Center. The OGLE-III data used in this paper is publicly available via the OGLE data archive http://ogledb.astrouw.edu.pl/~ogle/OCVS/. The OGLE-IV data has been kindly provided by the OGLE Team. This work made extensive use of TOPCAT (Taylor 2005) and VARTOOLS (Hartman & Bakos 2016).
References
- Eddington, A. S., & Plakidis, S. 1929, MNRAS, 90, 65 [NASA ADS] [CrossRef] [Google Scholar]
- Hartman, J. D., & Bakos, G. Á. 2016, Astron. Comput., 17, 1 [Google Scholar]
- Hinkle, K. H., Lebzelter, T., Joyce, R. R., & Fekel, F. C. 2002, AJ, 123, 1002 [Google Scholar]
- Houk, N. 1963, AJ, 68, 253 [Google Scholar]
- Iwanek, P., Kozłowski, S., Gromadzki, M., et al. 2021a, ApJS, 257, 23 [NASA ADS] [CrossRef] [Google Scholar]
- Iwanek, P., Soszyński, I., & Kozłowski, S. 2021b, ApJ, 919, 99 [NASA ADS] [CrossRef] [Google Scholar]
- McDonald, I., & Trabucchi, M. 2019, MNRAS, 484, 4678 [Google Scholar]
- O’Connell, D. J. K. 1933, Harvard College Observ. Bull., 893, 19 [Google Scholar]
- Pawlak, M., Pejcha, O., Jakubčik, P., et al. 2019, MNRAS, 487, 5932 [NASA ADS] [CrossRef] [Google Scholar]
- Payne-Gaposchkin, C. 1954, Ann. Harvard College Observ., 113, 189 [Google Scholar]
- Percy, J. R., & Au, W. W.-Y. 1999, PASP, 111, 98 [NASA ADS] [CrossRef] [Google Scholar]
- Percy, J. R., & Colivas, T. 1999, PASP, 111, 94 [NASA ADS] [CrossRef] [Google Scholar]
- Plakidis, S. 1932, MNRAS, 92, 460 [NASA ADS] [CrossRef] [Google Scholar]
- Saio, H., Wood, P. R., Takayama, M., & Ita, Y. 2015, MNRAS, 452, 3863 [Google Scholar]
- Skrutskie, et al. 2006, AJ, 131, 1163 [NASA ADS] [CrossRef] [Google Scholar]
- Soszyński, I. 2007, ApJ, 660, 1486 [Google Scholar]
- Soszyński & Udalski 2014, ApJ, 788, 13 [CrossRef] [Google Scholar]
- Soszyński, I., Udalski, A., Kubiak, M., et al. 2005, AcA, 55, 331 [Google Scholar]
- Soszynski, I., Dziembowski, W. A., Udalski, A., et al. 2007, Acta Astron., 57, 201 [NASA ADS] [Google Scholar]
- Soszyński, I., Olechowska, A., Ratajczak, M., et al. 2021, ApJ, 911, L22 [CrossRef] [Google Scholar]
- Sterne, T. E., & Campbell, L. 1937, AnHar, 105, 459 [NASA ADS] [Google Scholar]
- Taylor, M. B. 2005, ASPC, 347, 29 [Google Scholar]
- Trabucchi, M., Wood, P. R., Montalbán, J., et al. 2017, ApJ, 847, 139 [Google Scholar]
- Udalski, A. 2003, Acta Astron., 53, 291 [NASA ADS] [Google Scholar]
- Udalski, A., Szymanski, M. K., & Szymanski, G., 2015, AcA, 65, 1 [Google Scholar]
- Wood, P. R. 2000a, IAU Colloq. 176: The Impact of Large-Scale Surveys on Pulsating Star Research, 203, 379 [Google Scholar]
- Wood, P. R. 2000b, PASA, 17, 18 [Google Scholar]
- Wood, P. R., Alcock, C., Allsman, R. A., et al. 1999, Asymptotic Giant Branch Stars, 191, 151 [Google Scholar]
- Wood, P. R., Olivier, E. A., & Kawaler, S. D. 2004, ApJ, 604, 800 [Google Scholar]
- Wright, E. L., Eisenhardt, P. R. M., Mainzer, A. K., et al. 2010, AJ, 140, 1868 [Google Scholar]
- Zechmeister, M., & Kürster, M. 2009, A&A, 496, 577 [CrossRef] [EDP Sciences] [Google Scholar]
All Tables
All Figures
|
Fig. 1 Period-luminosity relations (PLRs) in the reddening-free WJK index, formed by the three types of LPVs: OSARGs, SRVs, and Miras as classified by Soszyński et al. (2007). Miras, for which a period with a significantly high S/N in the pre-whitened light curve was detected, are marked in red, with the strongest period detected after pre-whitening. |
| In the text | |
|
Fig. 2 Example light curves of the LSP Mira candidates identified in this work. For each star, the original unfolded OGLE light curve is shown in the left panel, the light curve folded with the fundamental mode pulsational period in the middle panel, and the light curve, with the fundamental mode prewhitened, folded with the putative LSP in the right panel. |
| In the text | |
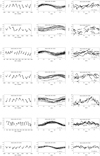 |
Fig. 3 Same as Fig. 2, but for O-rich candidates only. |
| In the text | |
|
Fig. 4 PLR in WJK index formed by Mira LSP candidates. C-rich Miras are known LSP SRVs. PLRs derived for LSPs by Soszyński et al. (2007) are marked with solid lines (C-rich - solid line, O-rich =− dashed line). |
| In the text | |
|
Fig. 5 PLR in the Wise [3.6] band. |
| In the text | |
|
Fig. 6 Amplitude comparison for LSP SRVs and candidates for LSP Miras. |
| In the text | |
|
Fig. 7 Cumulative distribution in pulsational periods for the LSP candidates and other Miras. |
| In the text | |
|
Fig. 8 Cumulative distribution in amplitudes of the pulsational variability for the LSP candidates and other Miras. |
| In the text | |
Current usage metrics show cumulative count of Article Views (full-text article views including HTML views, PDF and ePub downloads, according to the available data) and Abstracts Views on Vision4Press platform.
Data correspond to usage on the plateform after 2015. The current usage metrics is available 48-96 hours after online publication and is updated daily on week days.
Initial download of the metrics may take a while.