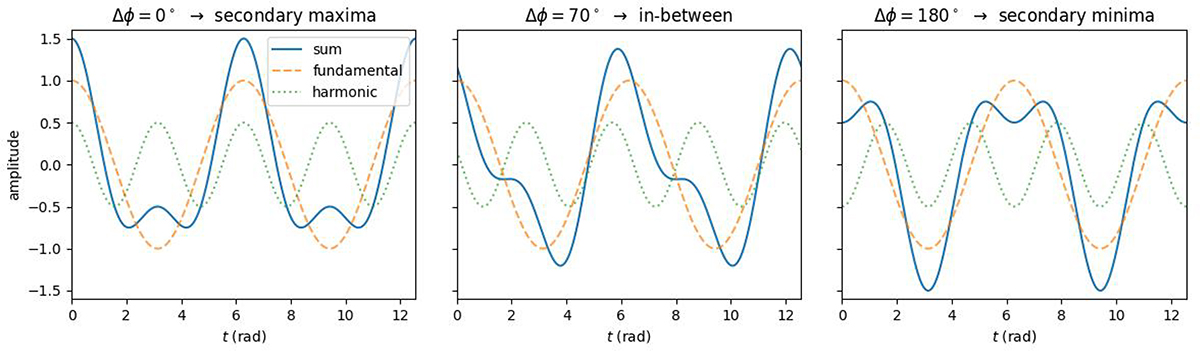
Fig. B.1.
Download original image
Example waveforms showing the sum of a fundamental signal and its first harmonic for a fixed amplitude ratio of 0.5. The three panels correspond to relative phase offsets of 0, 60, and 180°, illustrating how changes in the phase relationship between the two components produce distinct waveform shapes–ranging from profiles with secondary maxima to asymmetric peaks and secondary minima.
Current usage metrics show cumulative count of Article Views (full-text article views including HTML views, PDF and ePub downloads, according to the available data) and Abstracts Views on Vision4Press platform.
Data correspond to usage on the plateform after 2015. The current usage metrics is available 48-96 hours after online publication and is updated daily on week days.
Initial download of the metrics may take a while.