Open Access
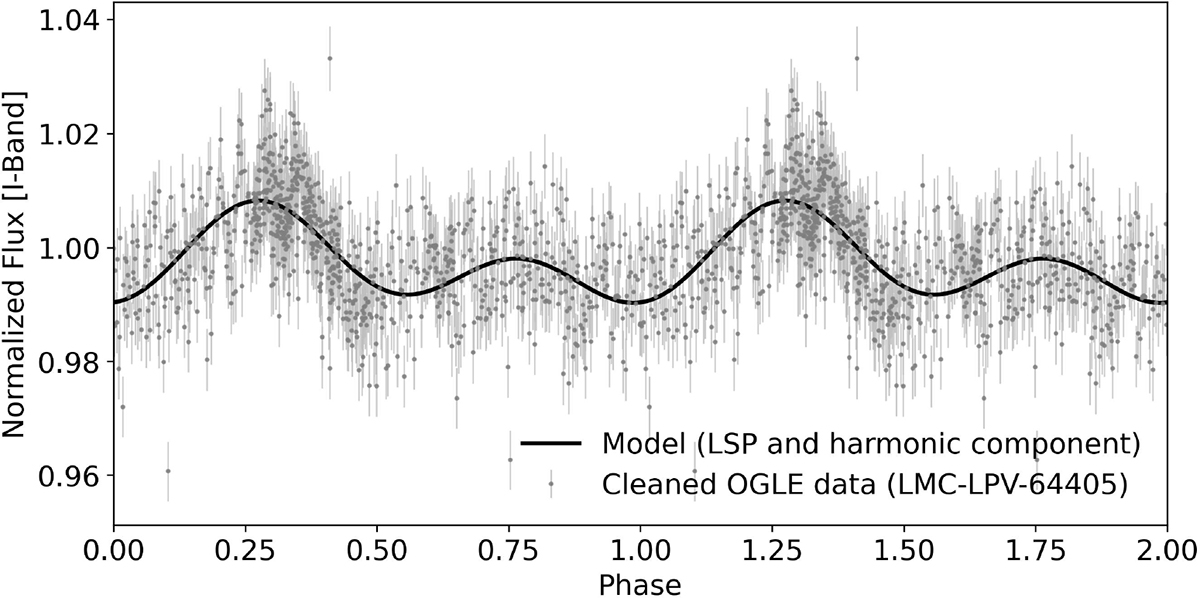
Fig. 5.
Download original image
Folded I-band light curve of OGLE-LMC-LPV-64405 filtered for the LSP signal and first harmonic. Grey points show cleaned OGLE data repeated over two cycles. The black curve is the model fit exhibiting a secondary maximum, consistent with an inclined dipole.
Current usage metrics show cumulative count of Article Views (full-text article views including HTML views, PDF and ePub downloads, according to the available data) and Abstracts Views on Vision4Press platform.
Data correspond to usage on the plateform after 2015. The current usage metrics is available 48-96 hours after online publication and is updated daily on week days.
Initial download of the metrics may take a while.